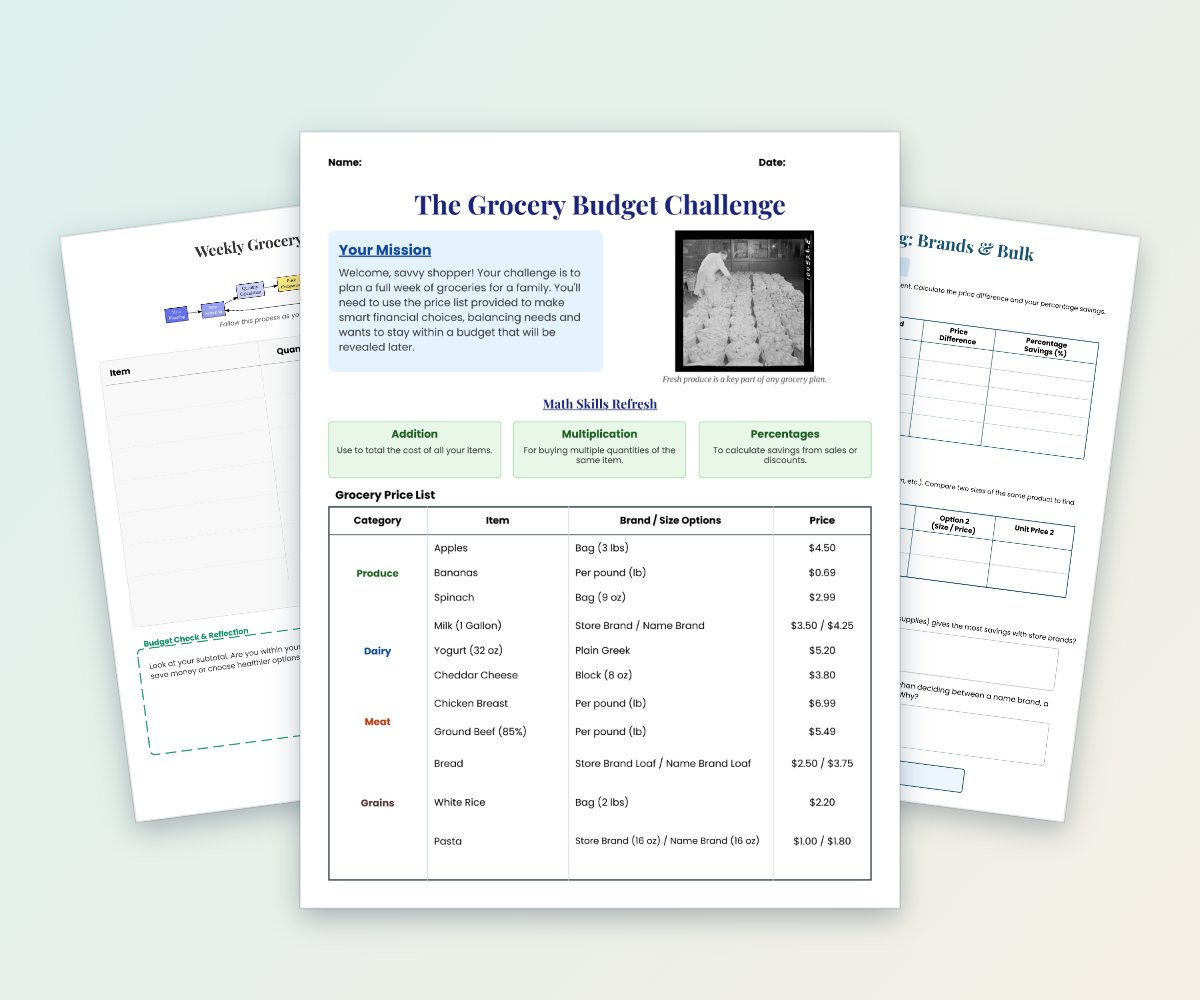
Grocery Budget Challenge: Smart Shopping Math
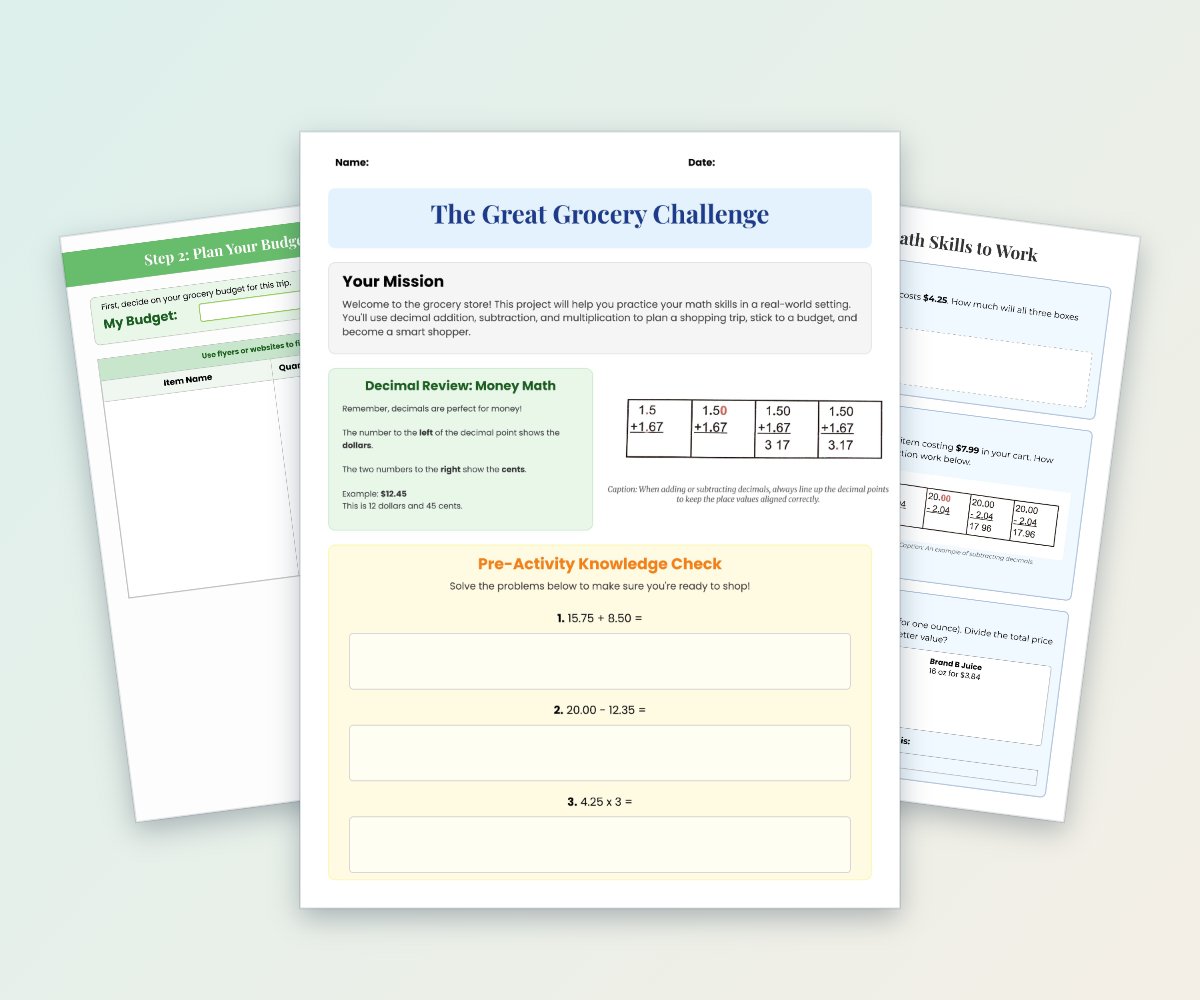
Students plan a week of groceries for a family while working within a budget.
$5.99
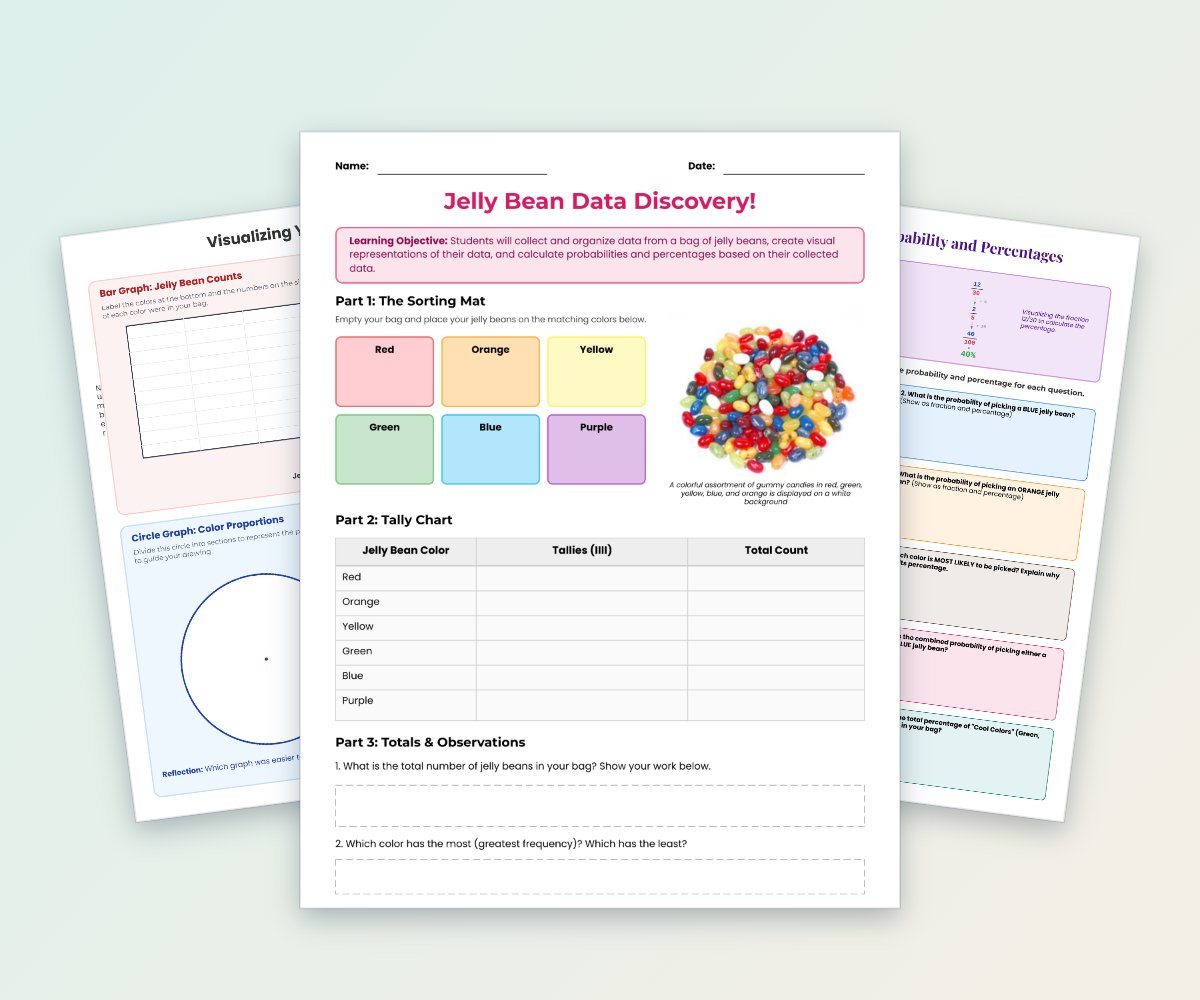
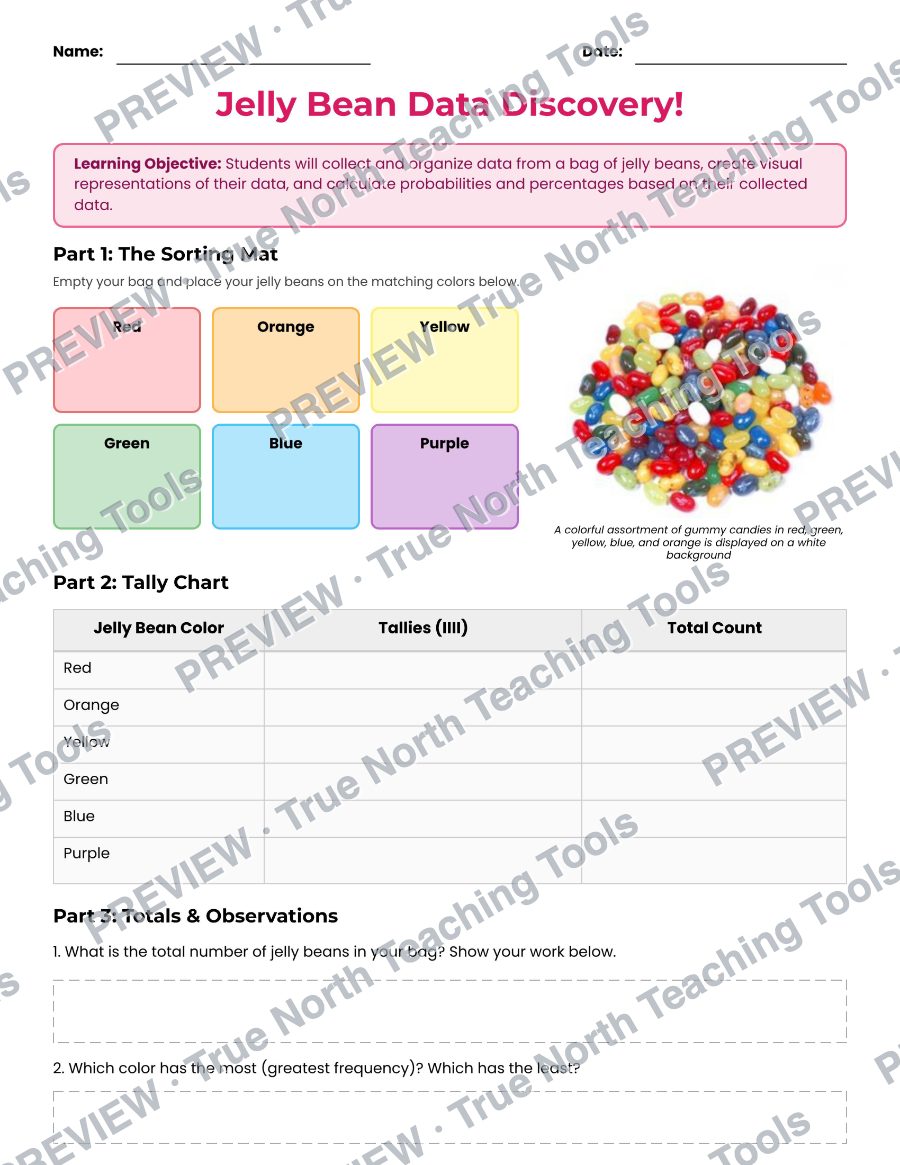
Students sort jelly beans by color, record tallies, create bar and circle graphs, and analyze frequency.
Students sort jelly beans by color, record tallies, create bar and circle graphs, and analyze frequency. They calculate probabilities and percentages using their collected data and complete a reflection.
For use by one educator and their students. Need a school or team licence? Contact us before sharing.
Watermarked, reduced-quality preview. The downloaded files are the full, unwatermarked pages.
Students plan a week of groceries for a family while working within a budget.
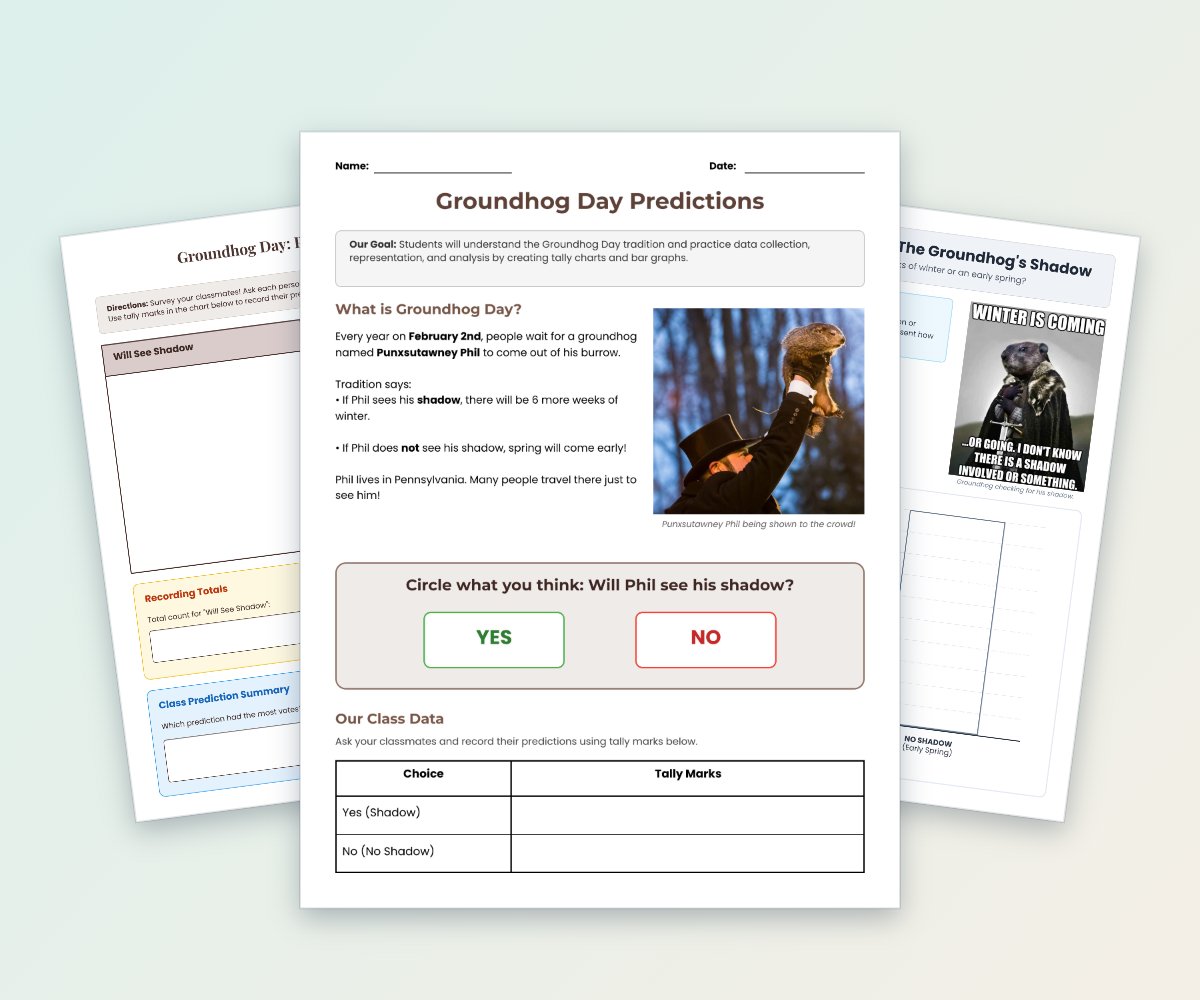
Students learn about the Groundhog Day tradition, survey classmates about their predictions, and record results with tally marks.
Students plan a grocery trip, create a shopping list, and use decimal addition, subtraction, multiplication, division, budgeting, and sales tax calculations.