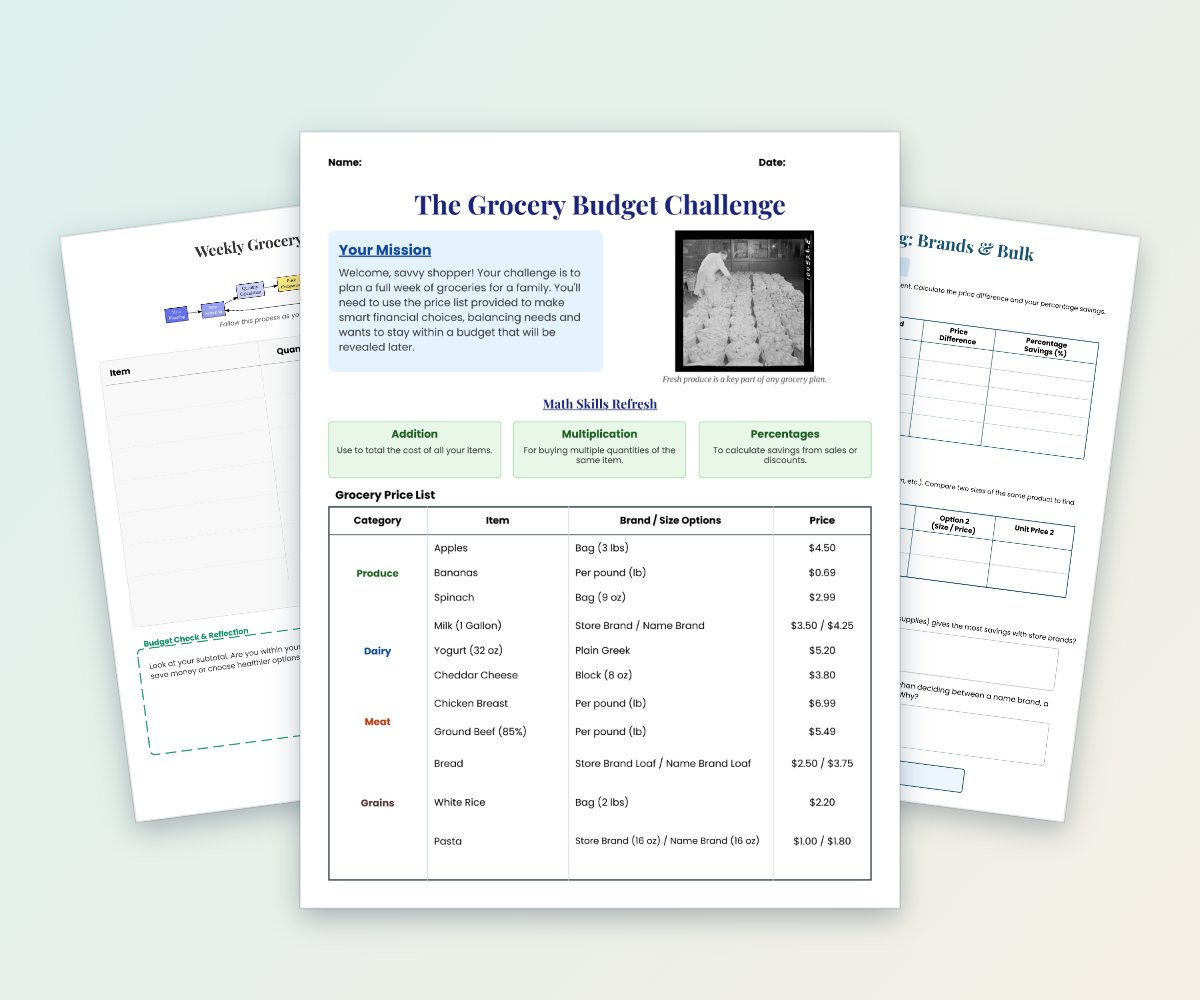
Grocery Budget Challenge: Smart Shopping Math
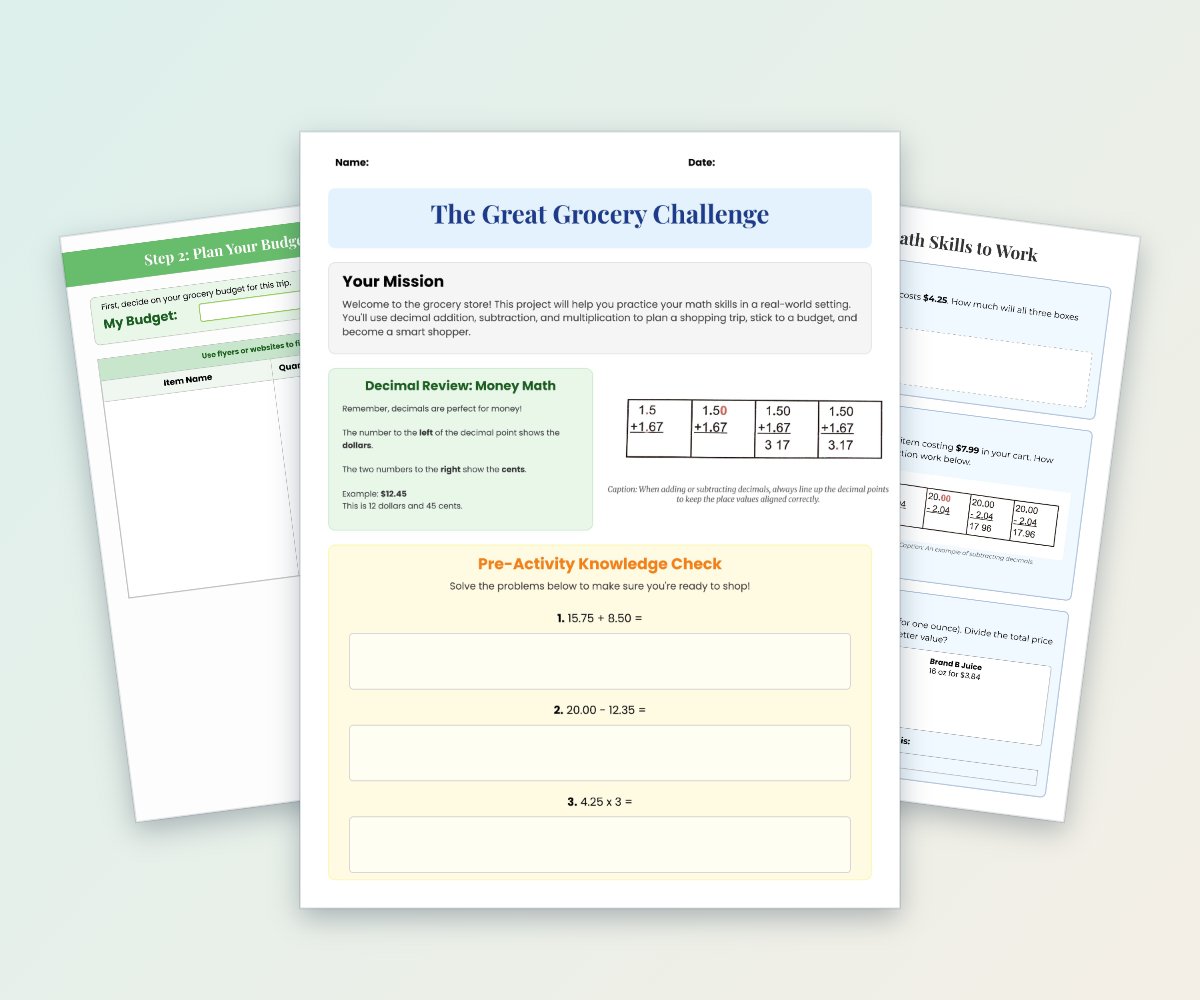
Students plan a week of groceries for a family while working within a budget.
$5.99
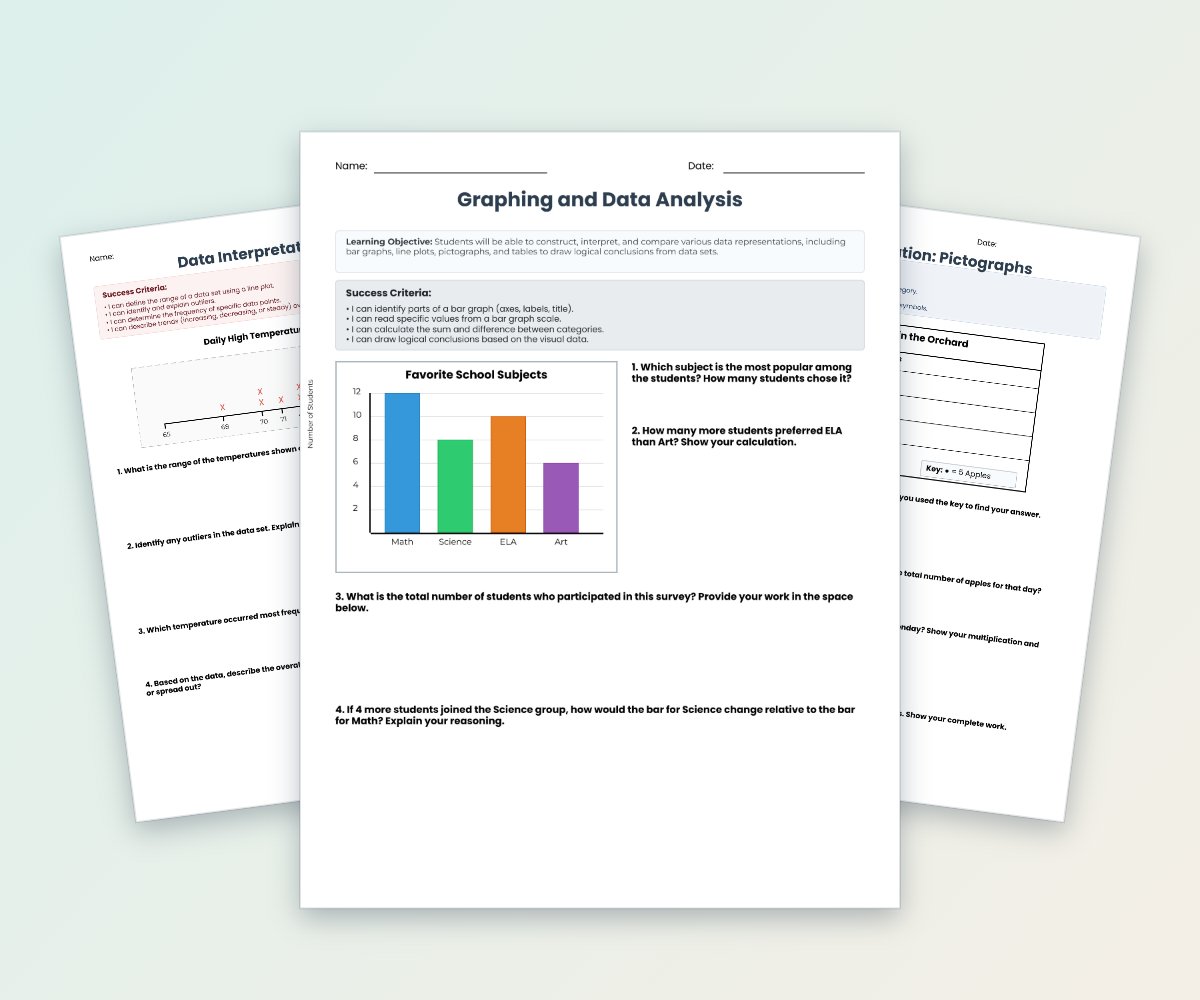
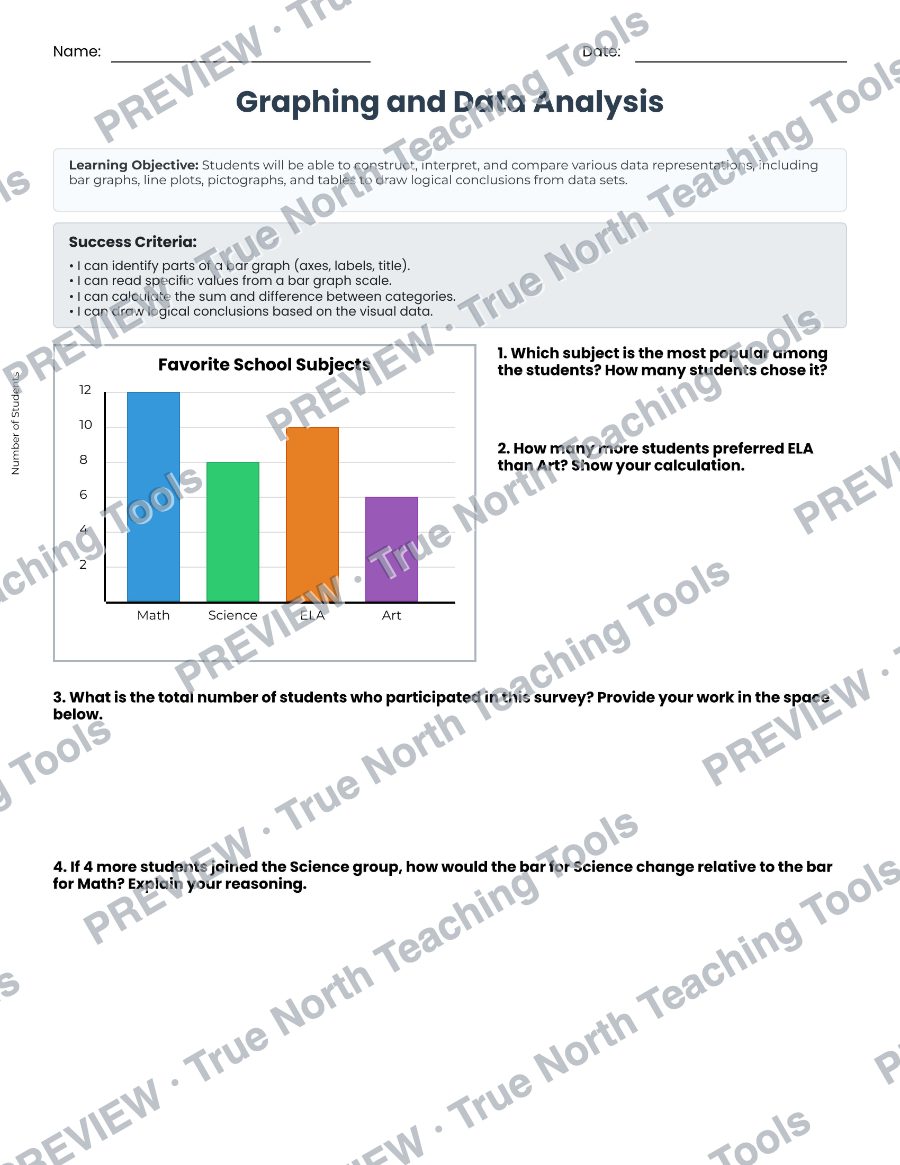
This six-page activity pack helps students interpret and create bar graphs, line plots, pictographs, and tables.
This six-page activity pack helps students interpret and create bar graphs, line plots, pictographs, and tables. Exercises cover comparing categories, calculating totals and differences, identifying range and outliers, and drawing conclusions from data.
For use by one educator and their students. Need a school or team licence? Contact us before sharing.
Watermarked, reduced-quality preview. The downloaded files are the full, unwatermarked pages.
Students plan a week of groceries for a family while working within a budget.
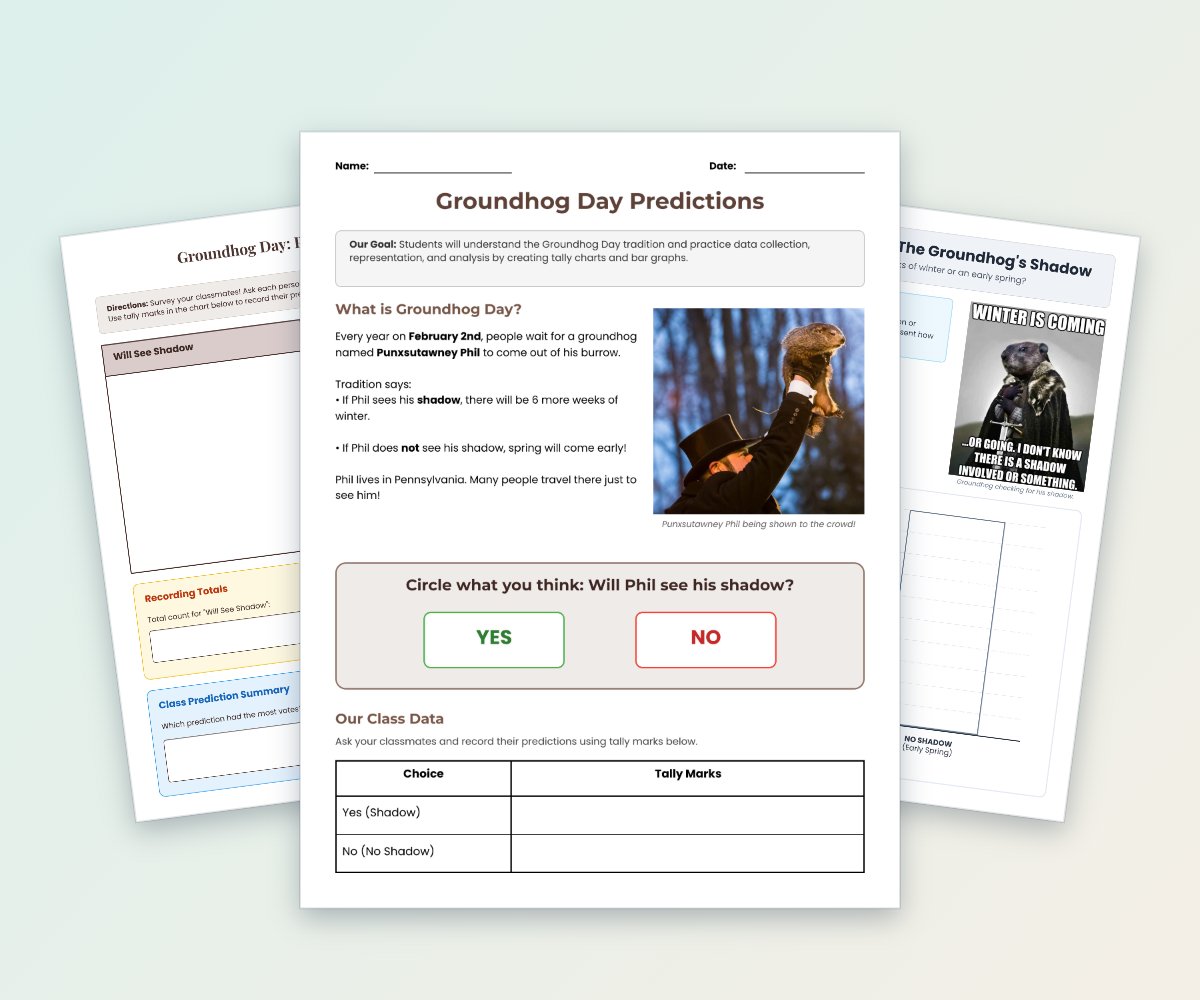
Students learn about the Groundhog Day tradition, survey classmates about their predictions, and record results with tally marks.
Students plan a grocery trip, create a shopping list, and use decimal addition, subtraction, multiplication, division, budgeting, and sales tax calculations.