
Pumpkin Measurement Activity
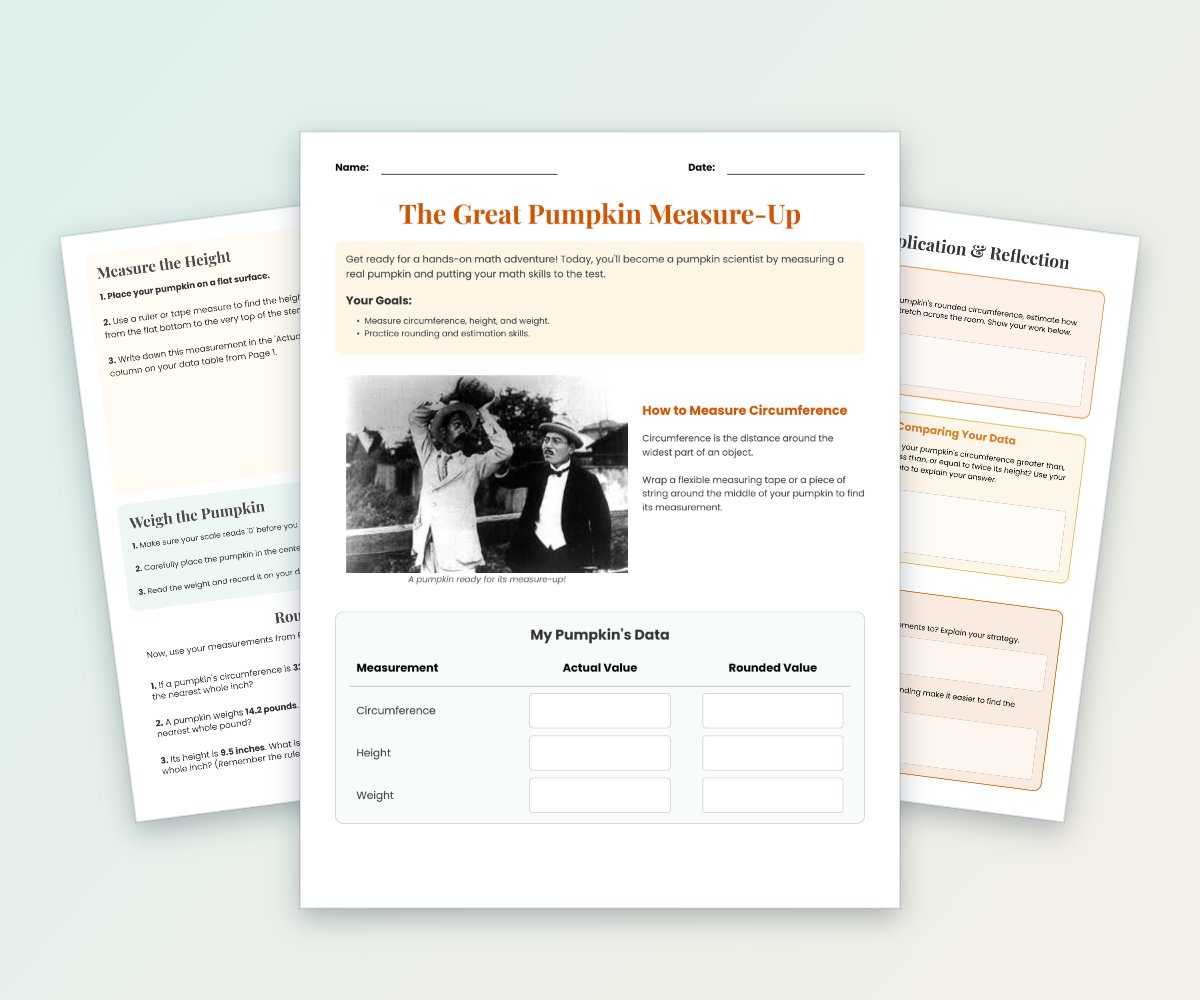
Students measure a real pumpkin’s circumference, height, and weight, record actual and rounded values, and practice estimation.
$2.50
Students analyze a 14-day spring temperature dataset by calculating the mean, median, mode, and range.
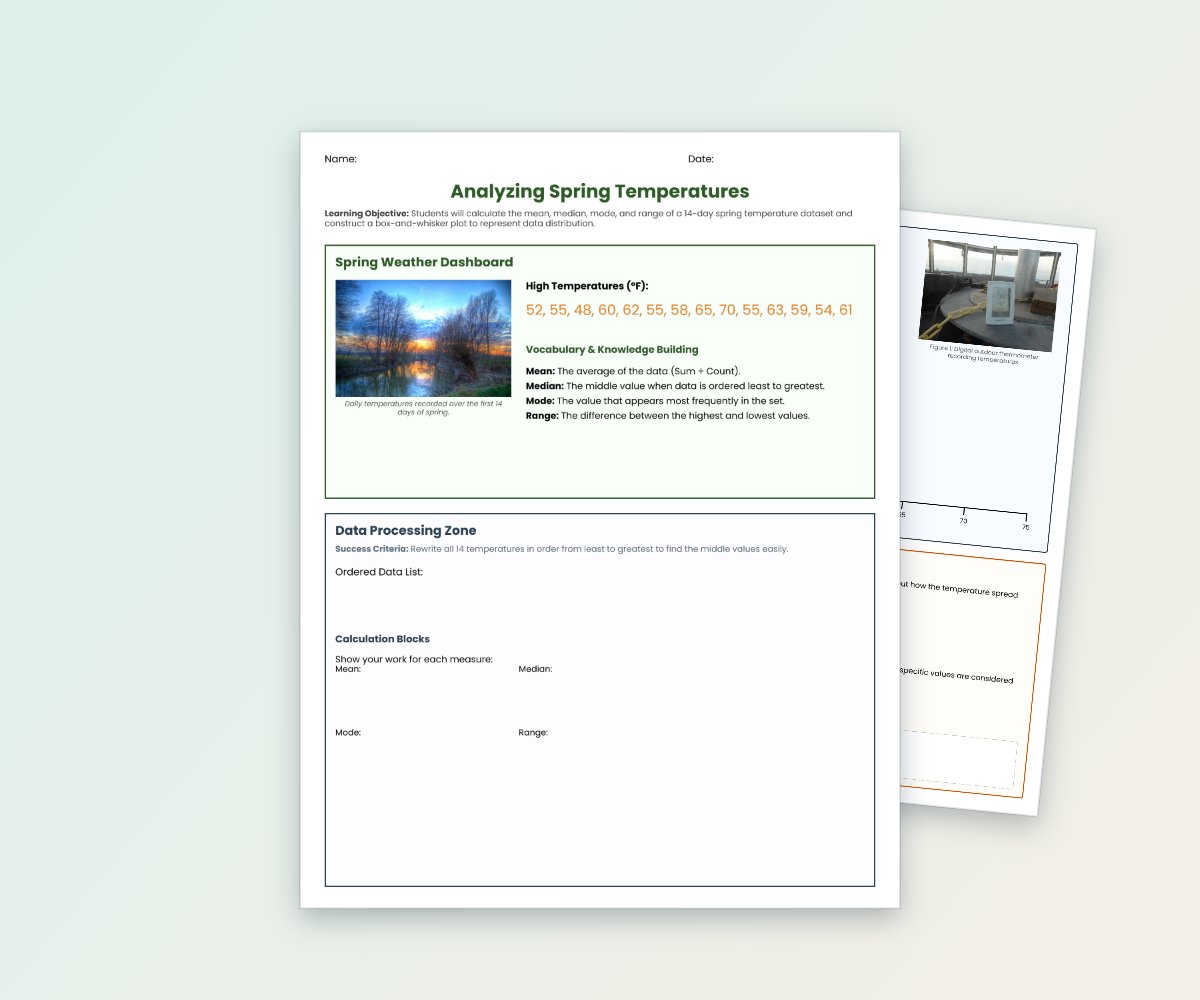
Students analyze a 14-day spring temperature dataset by calculating the mean, median, mode, and range. They organize the data, determine the five-number summary, construct a box-and-whisker plot, and reflect on data spread and outliers.
For use by one educator and their students. Need a school or team licence? Contact us before sharing.
Watermarked, reduced-quality preview. The downloaded files are the full, unwatermarked pages.
Students measure a real pumpkin’s circumference, height, and weight, record actual and rounded values, and practice estimation.
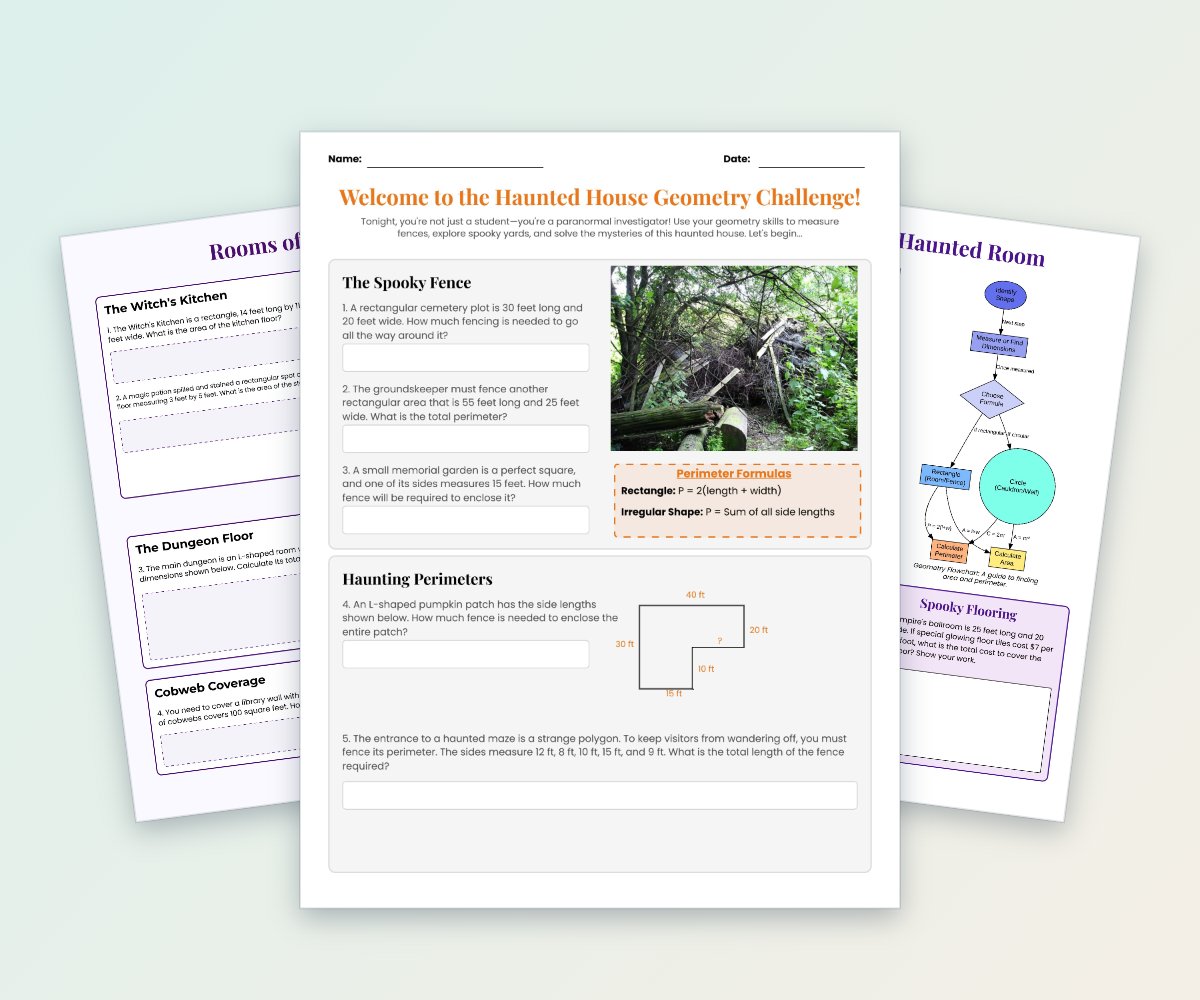
Students solve themed geometry problems involving the perimeter and area of rectangles, squares, polygons, and L-shaped figures.
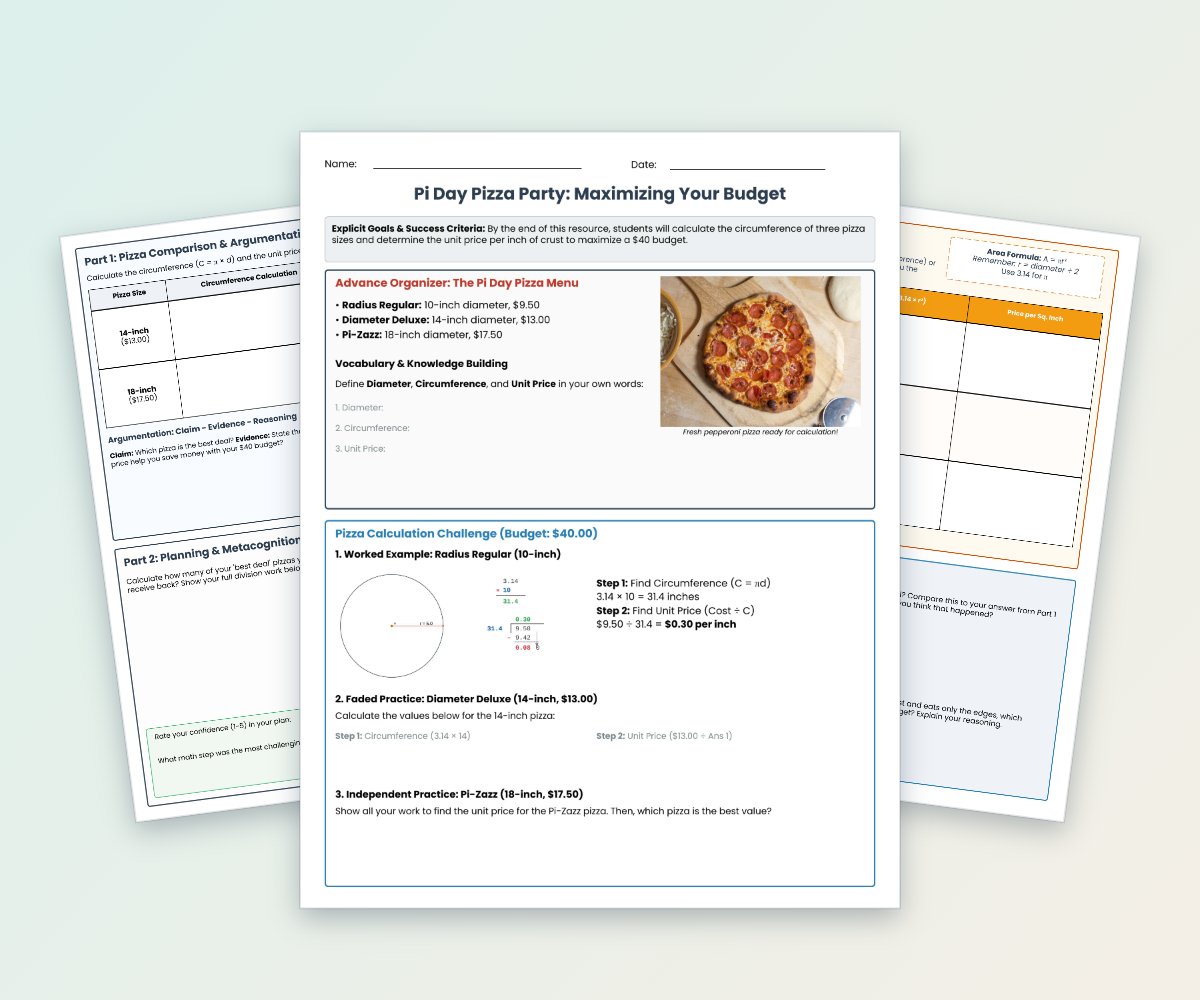
Students calculate pizza circumference, compare unit prices, maximize a $40 budget, and evaluate area-based value.
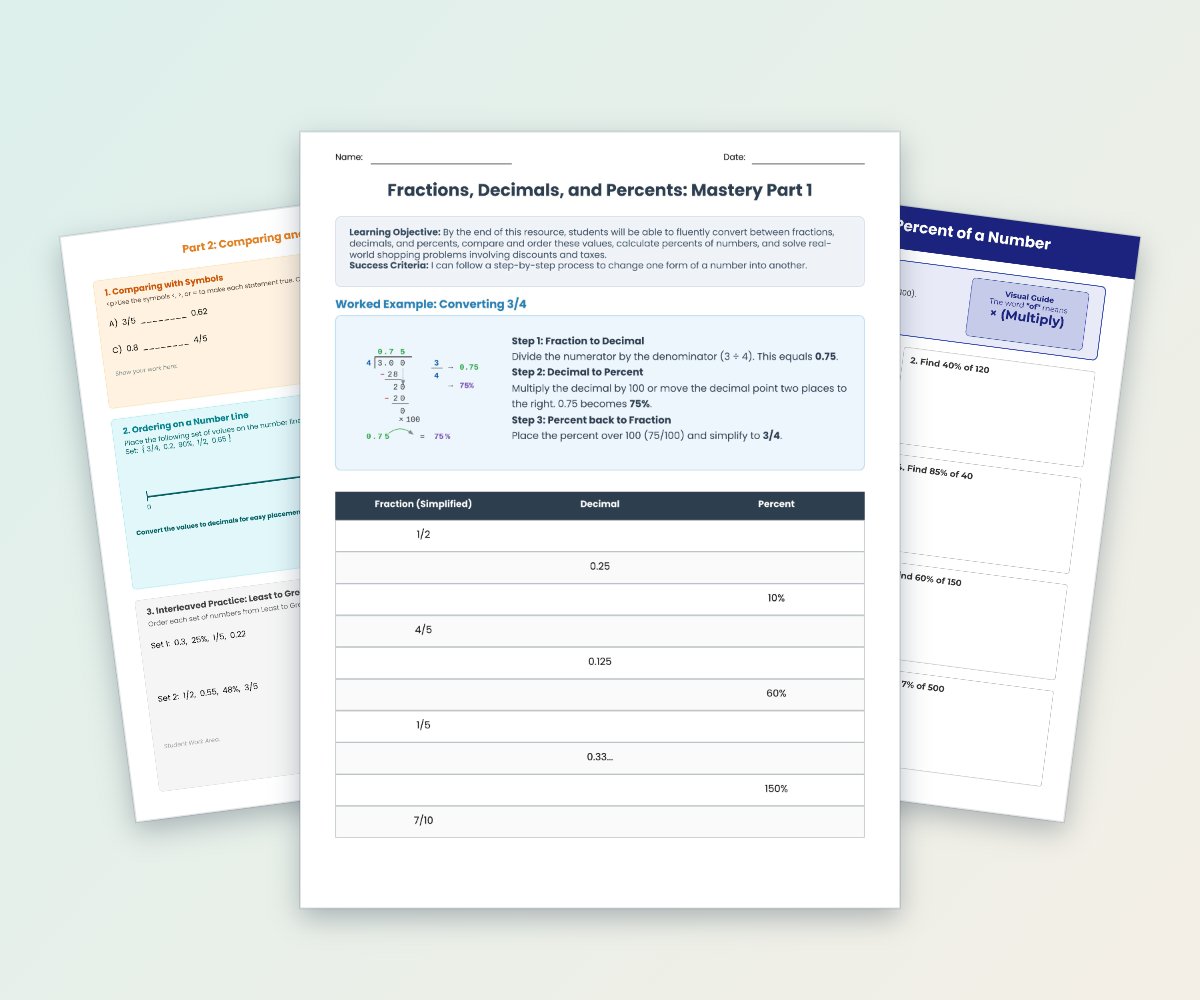
This six-page review pack teaches students to convert among fractions, decimals, and percents, compare and order values, calculate percentages, and solve shopping problems.
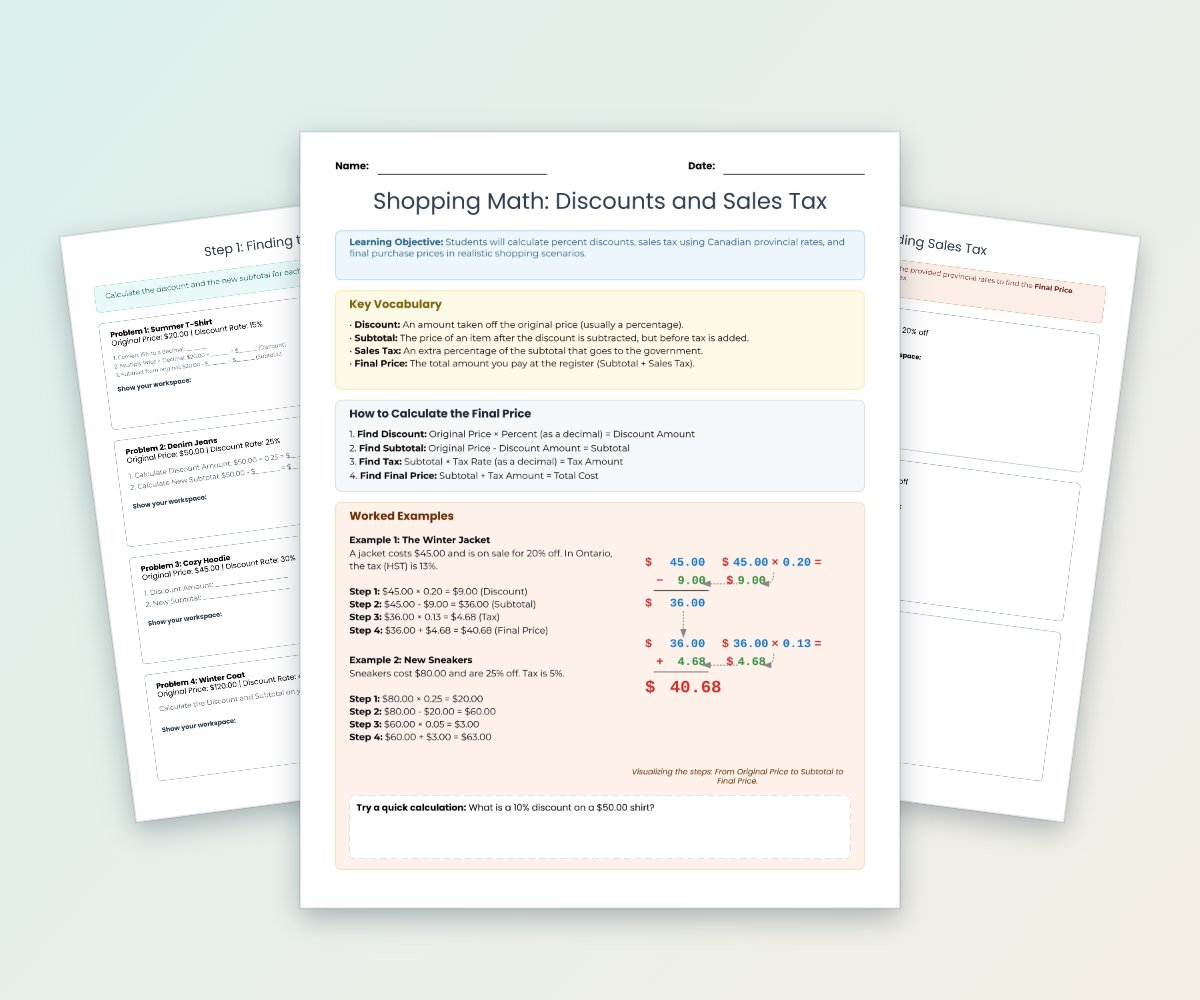
Students practice calculating percentage discounts, subtotals, sales tax, and final purchase prices using realistic shopping scenarios.
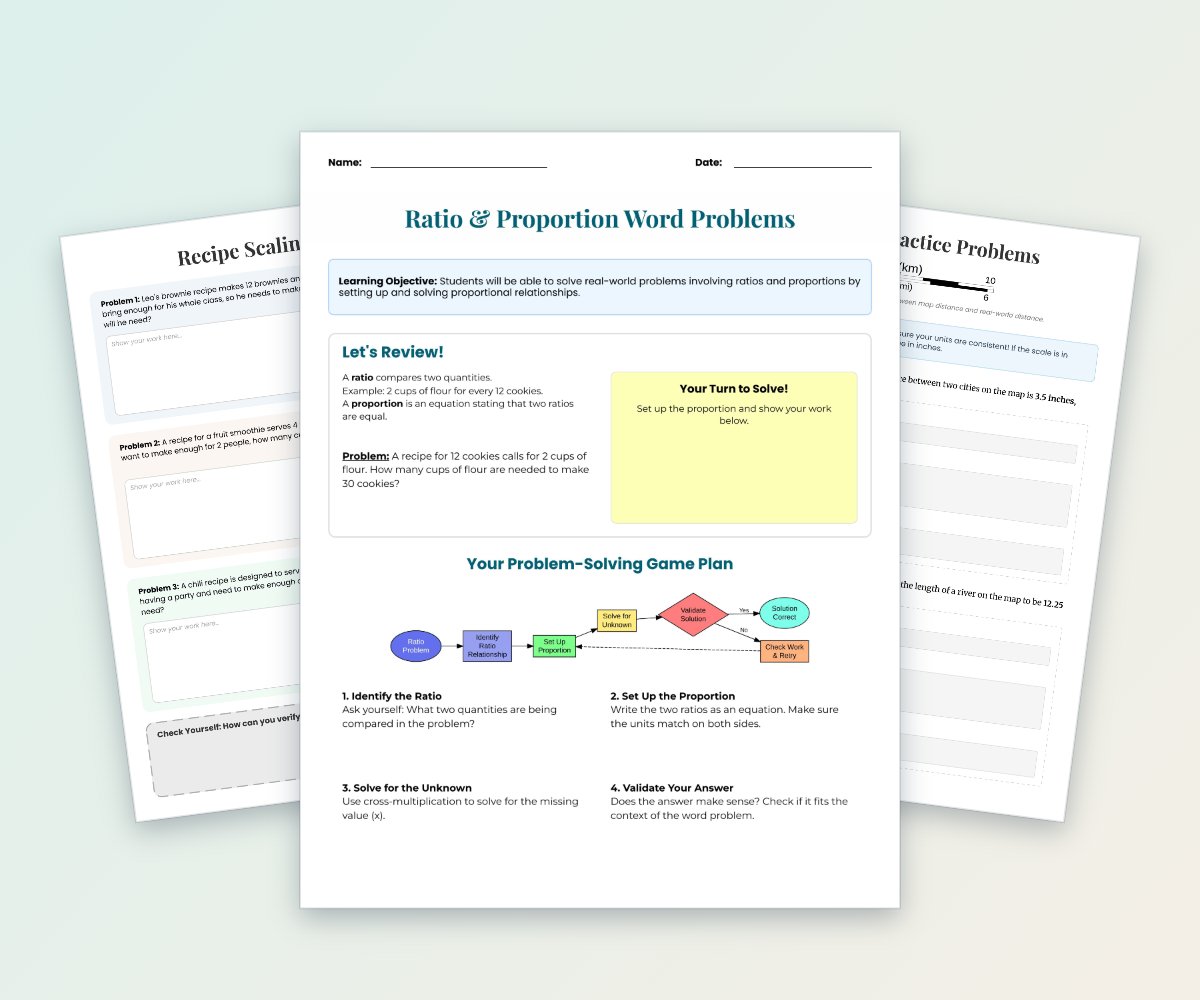
Students review ratios and proportions, then solve real-world problems involving recipe scaling and map scales.