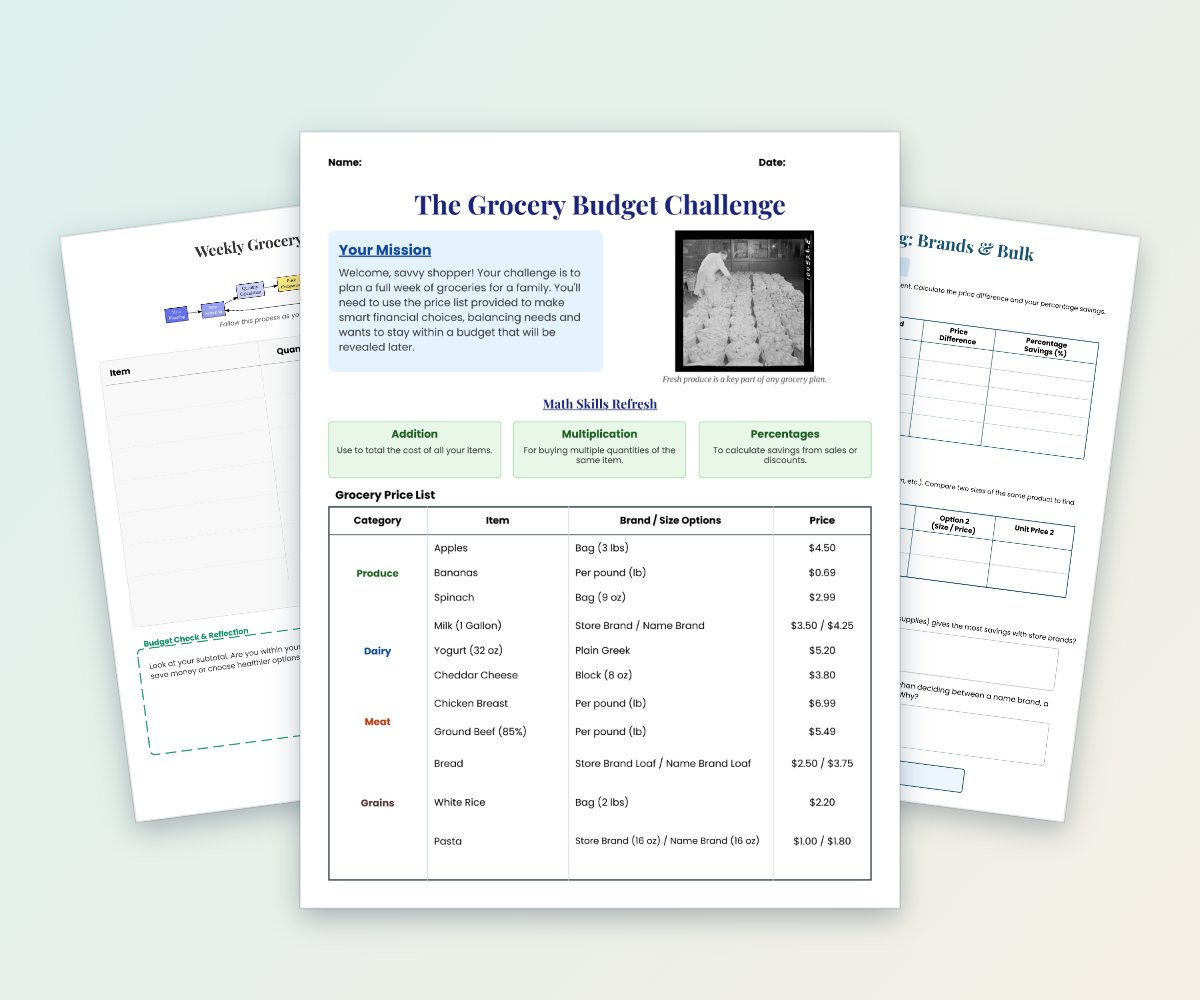
Grocery Budget Challenge: Smart Shopping Math
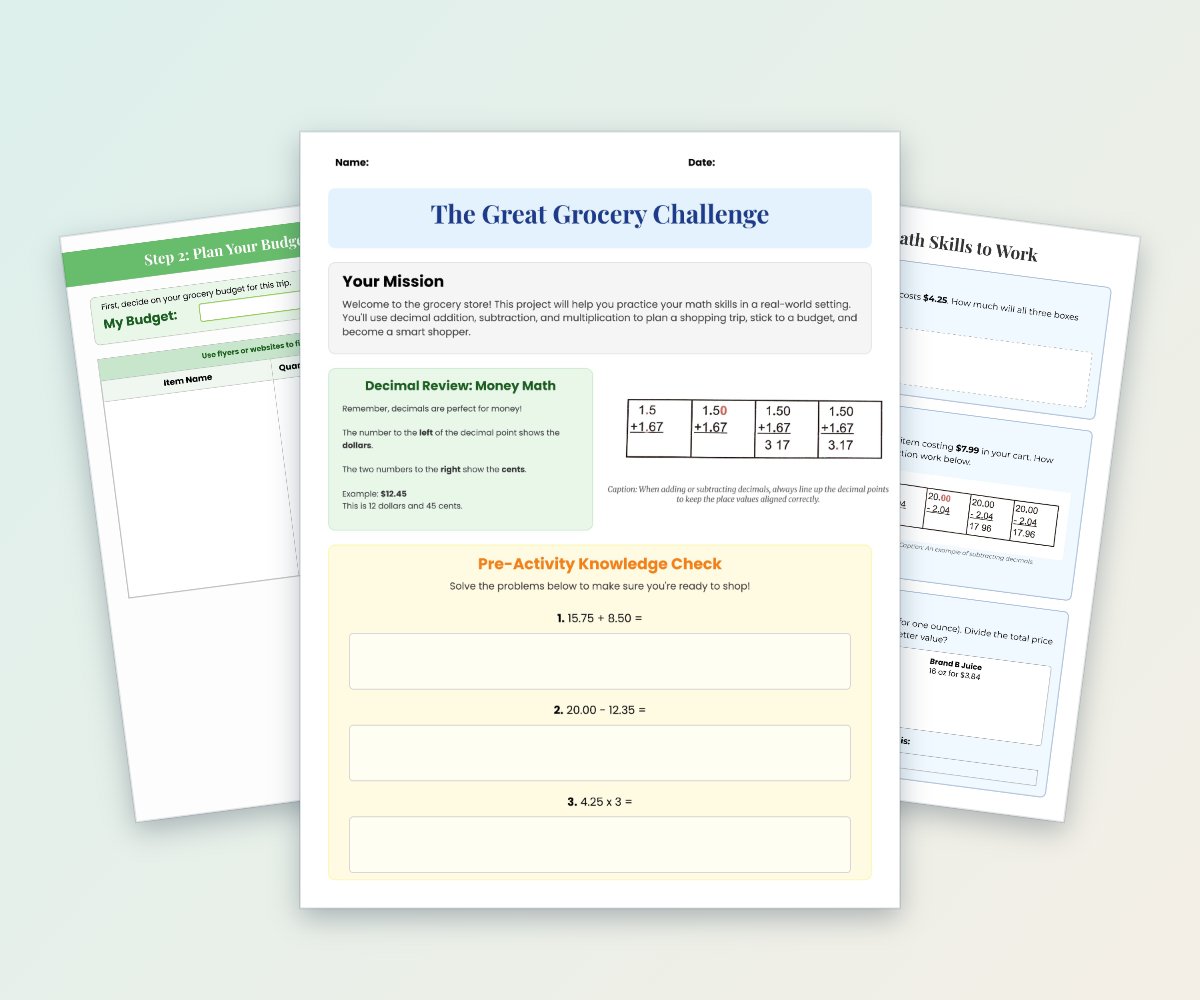
Students plan a week of groceries for a family while working within a budget.
$5.99
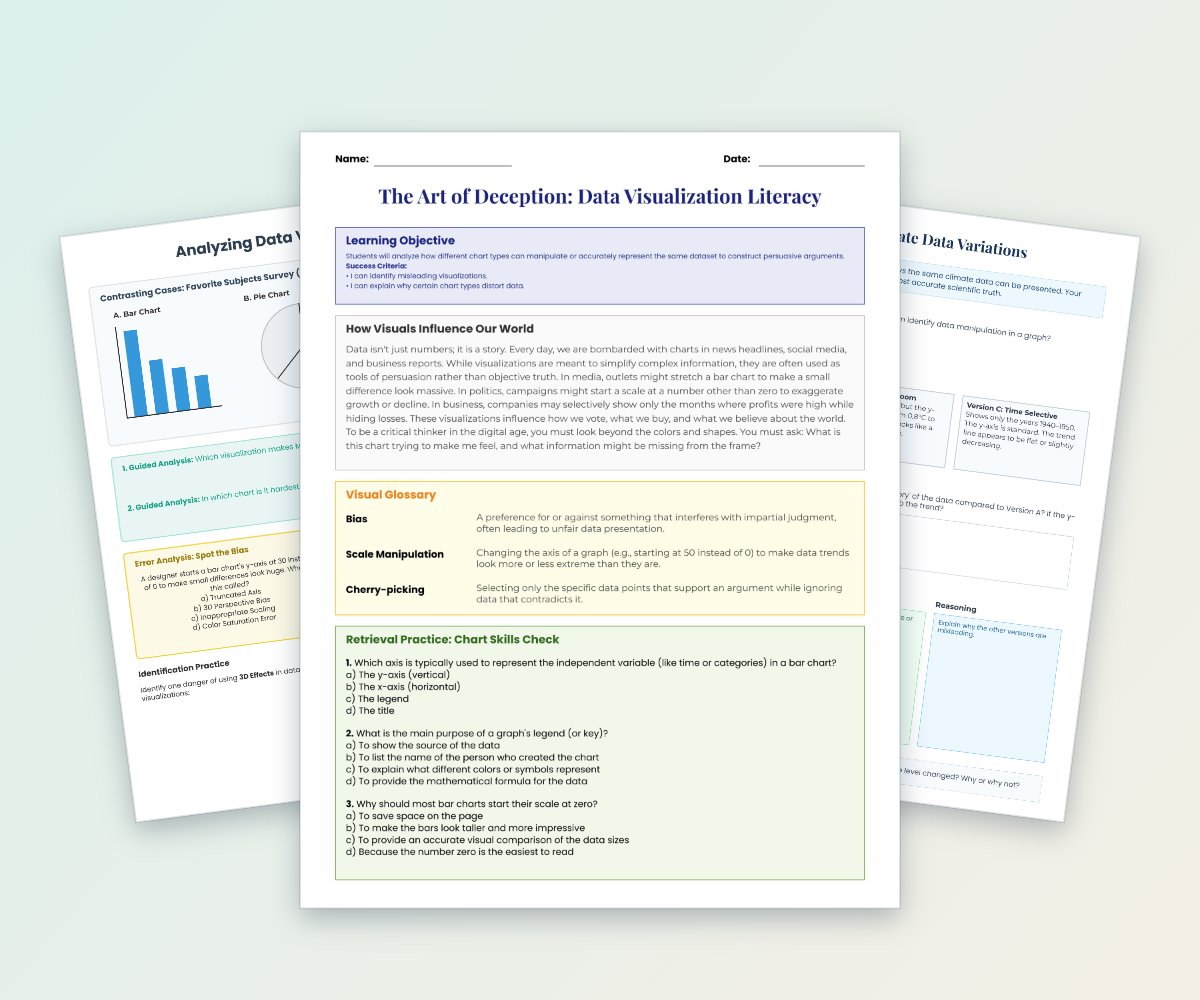
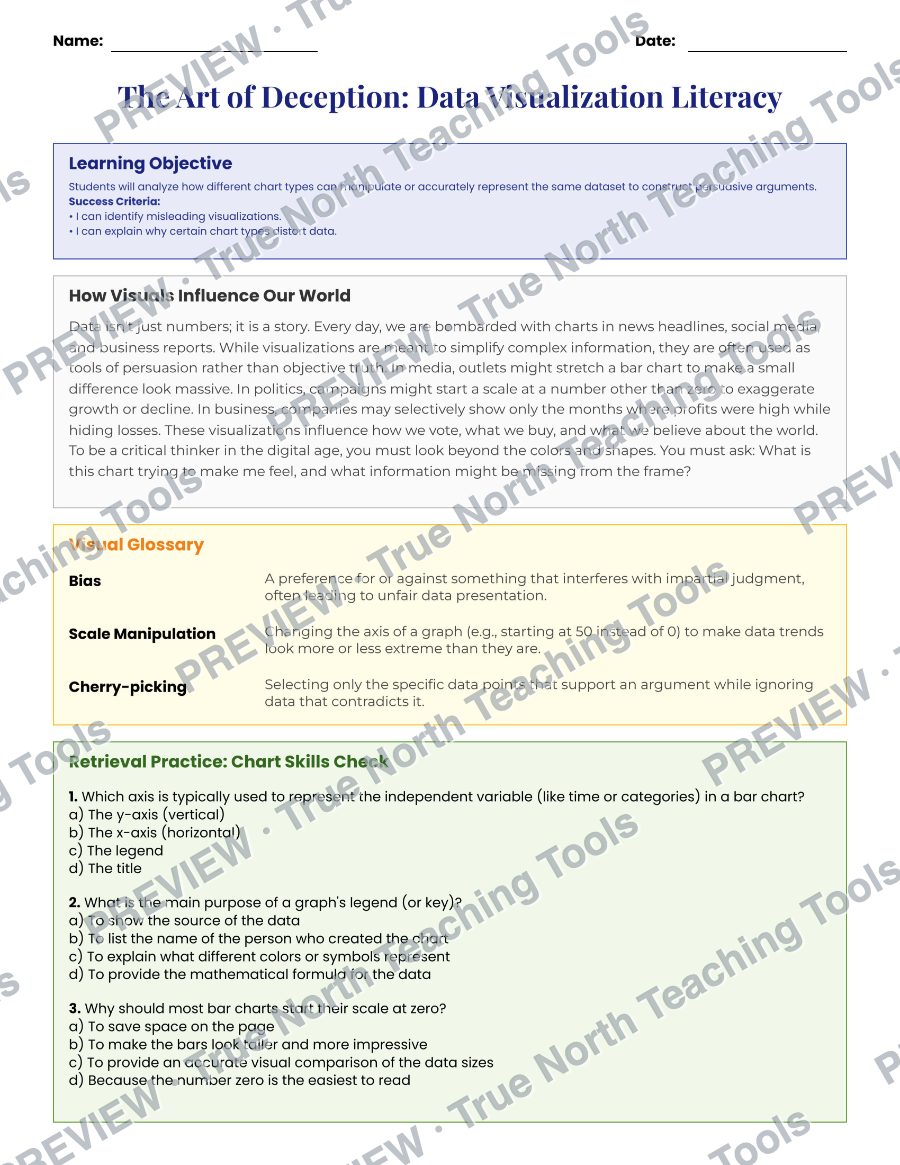
This four-page lesson introduces chart manipulation, bias, scale changes, and cherry-picking through examples and retrieval-practice questions.
This four-page lesson introduces chart manipulation, bias, scale changes, and cherry-picking through examples and retrieval-practice questions. Students compare bar and pie charts while evaluating how visual choices influence interpretation and persuasive arguments.
For use by one educator and their students. Need a school or team licence? Contact us before sharing.
Watermarked, reduced-quality preview. The downloaded files are the full, unwatermarked pages.
Students plan a week of groceries for a family while working within a budget.
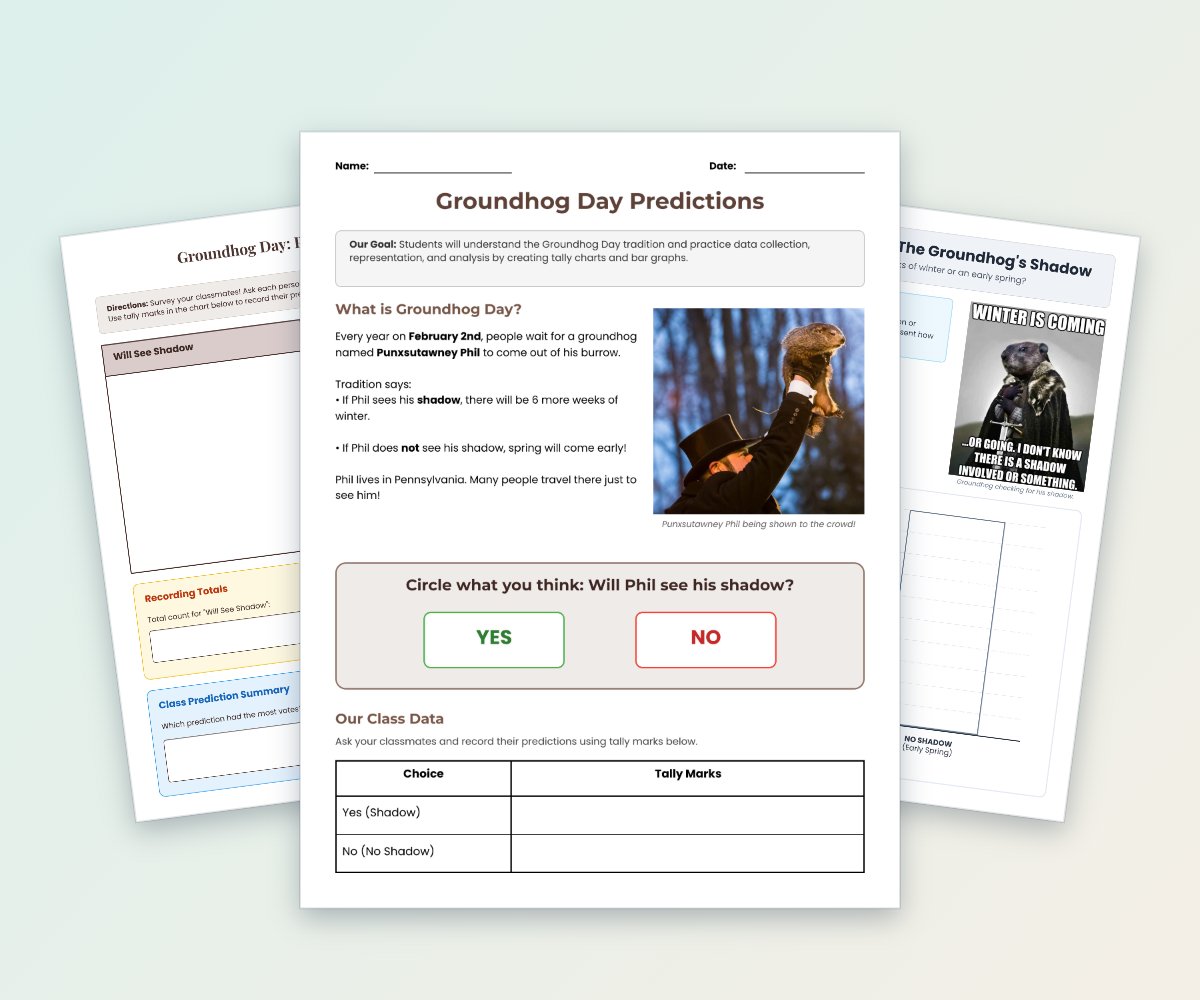
Students learn about the Groundhog Day tradition, survey classmates about their predictions, and record results with tally marks.
Students plan a grocery trip, create a shopping list, and use decimal addition, subtraction, multiplication, division, budgeting, and sales tax calculations.