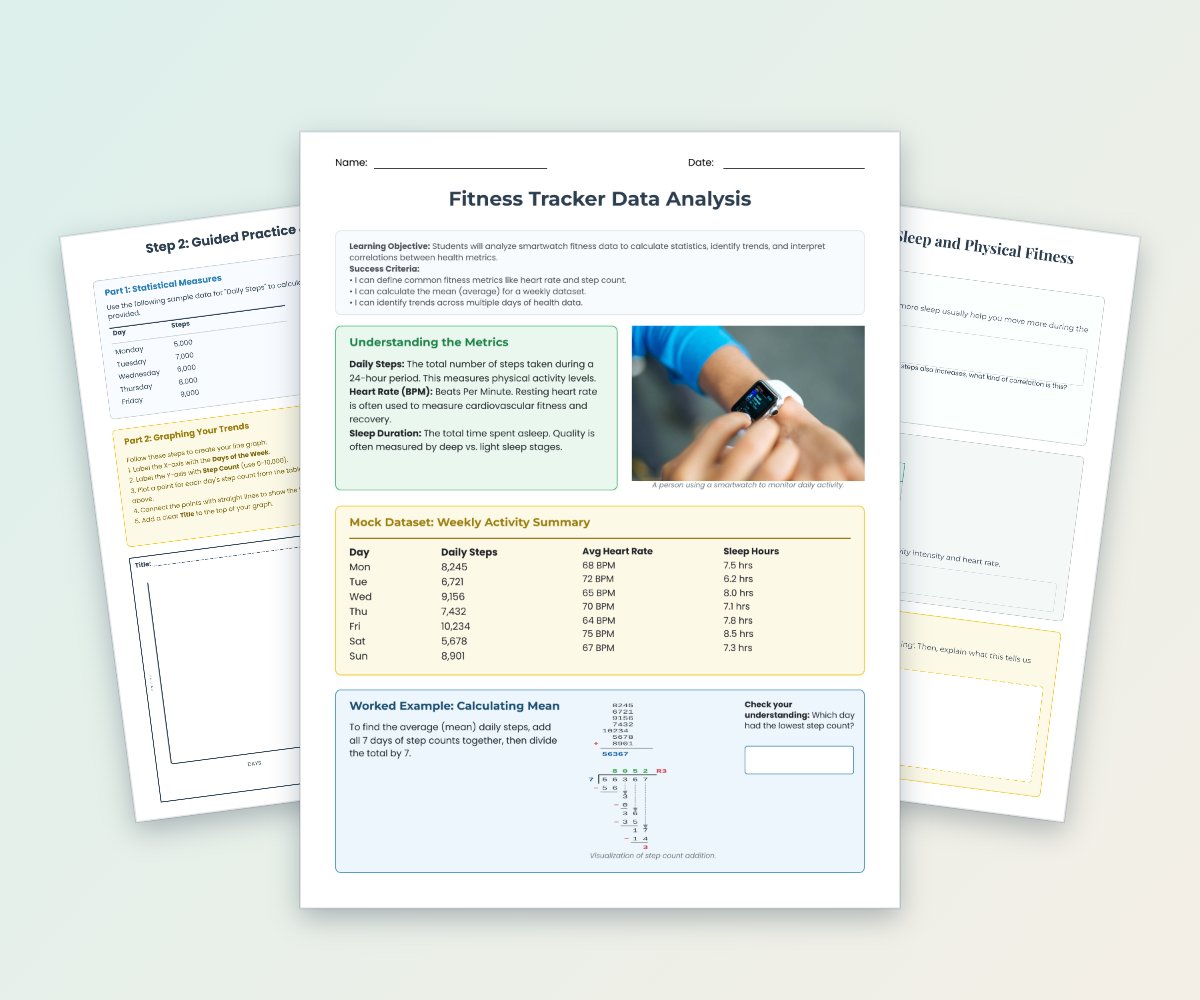
Fitness Data Math Analysis
Students analyze mock smartwatch fitness data involving steps, heart rate, and sleep duration.
$4.99
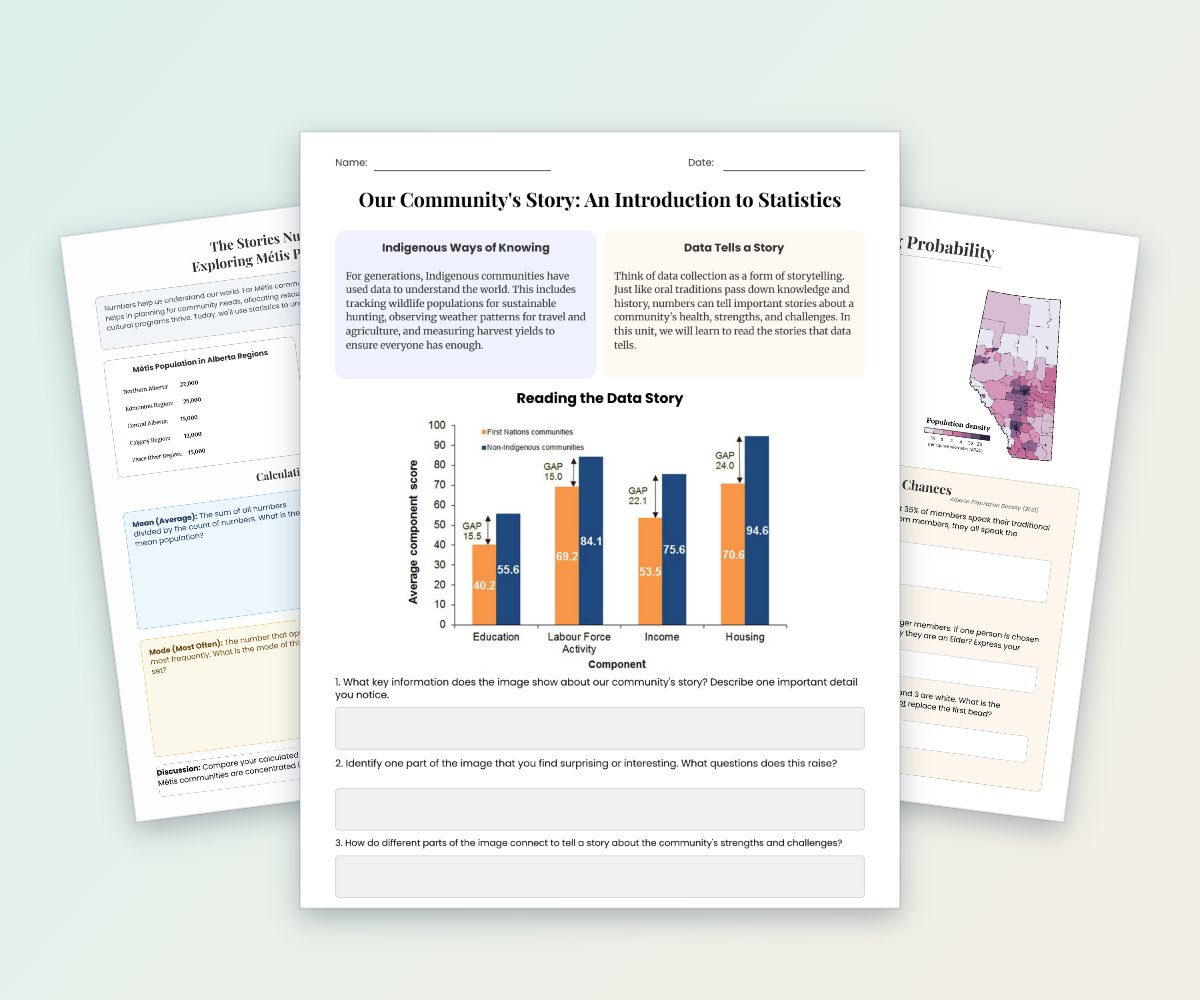
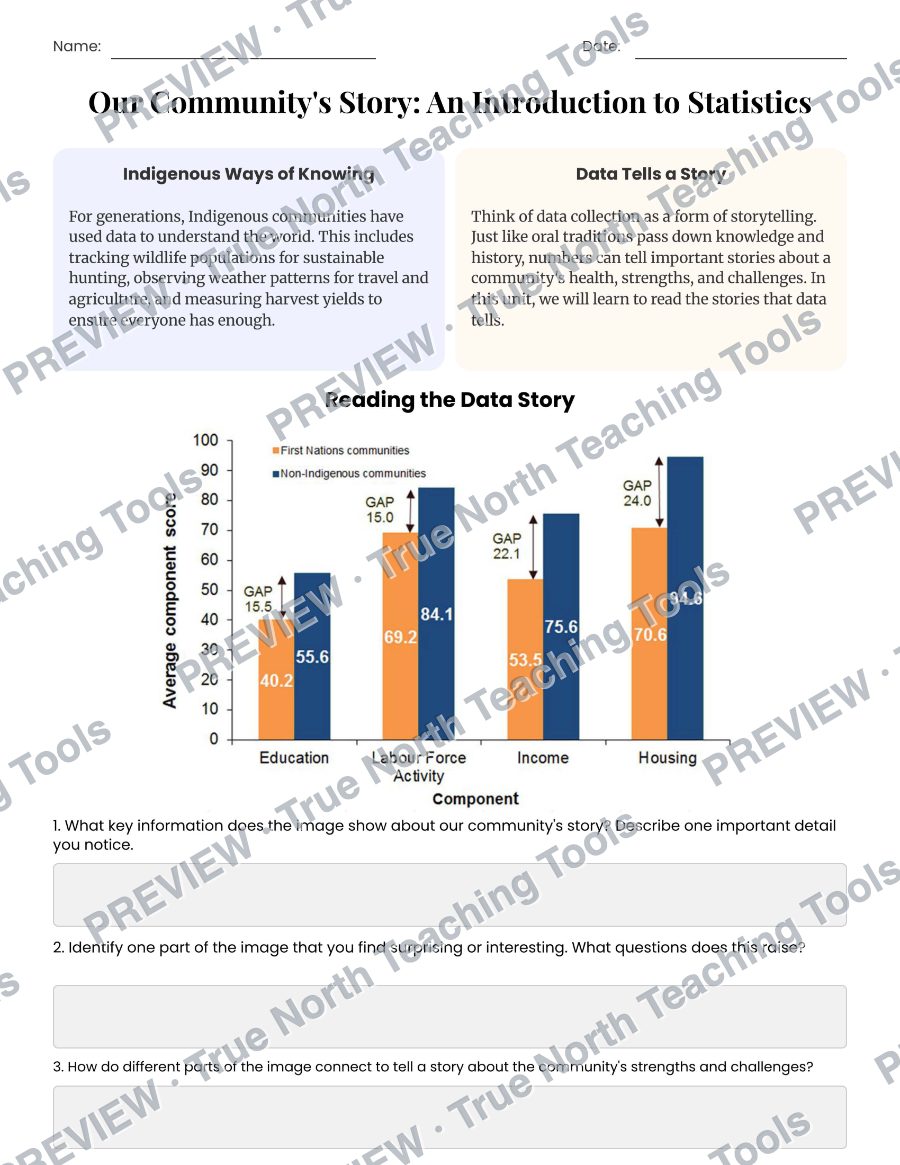
Students explore how Indigenous communities use data and interpret graphs about education, labour, income, housing, and Métis population distribution.
Students explore how Indigenous communities use data and interpret graphs about education, labour, income, housing, and Métis population distribution. The worksheet includes questions and practice calculating mean, mode, median, and range using Alberta population data.
For use by one educator and their students. Need a school or team licence? Contact us before sharing.
Watermarked, reduced-quality preview. The downloaded files are the full, unwatermarked pages.
Students analyze mock smartwatch fitness data involving steps, heart rate, and sleep duration.
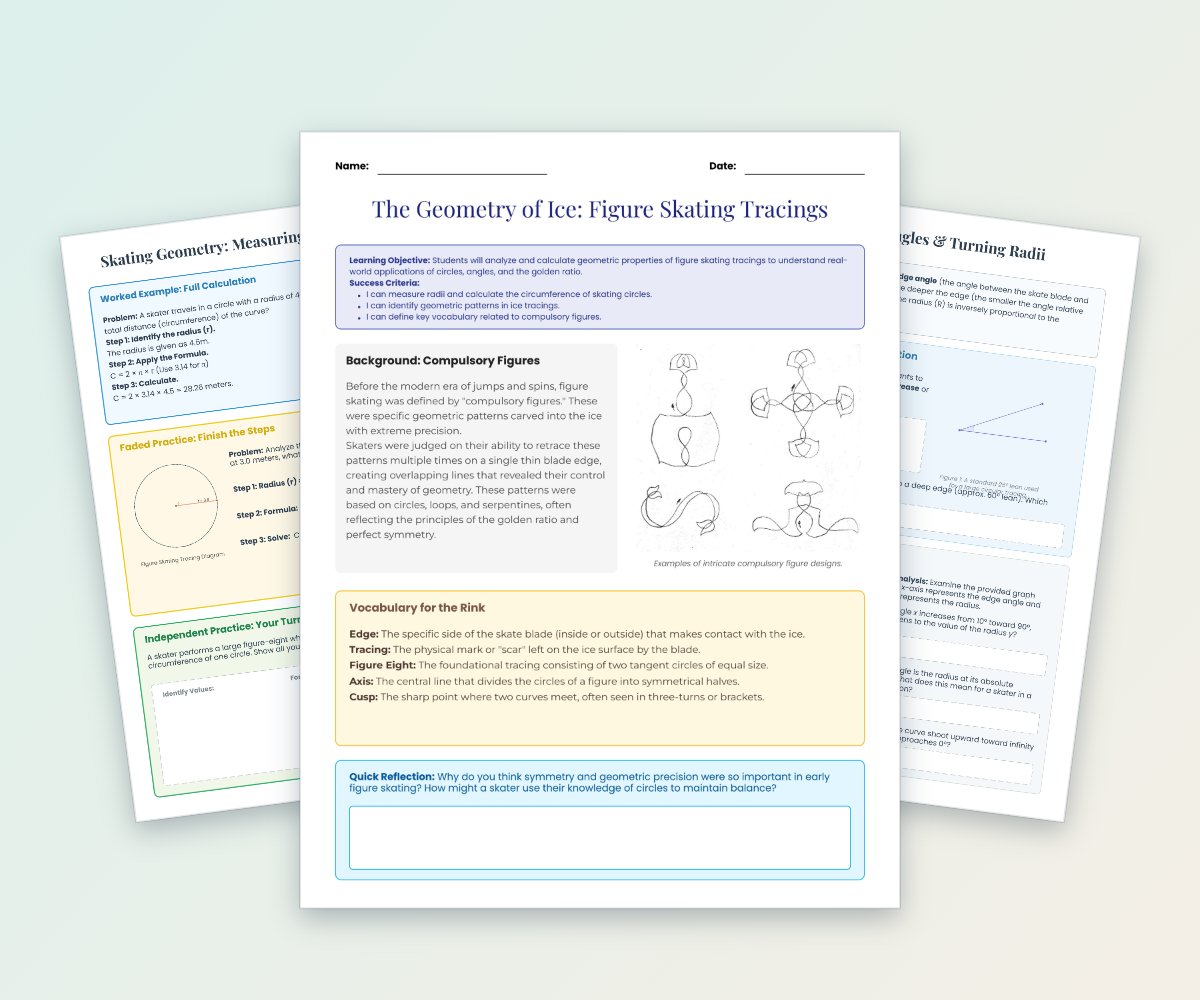
This four-page math worksheet connects figure skating tracings to geometric concepts including circles, circumference, angles, symmetry, and the golden ratio.
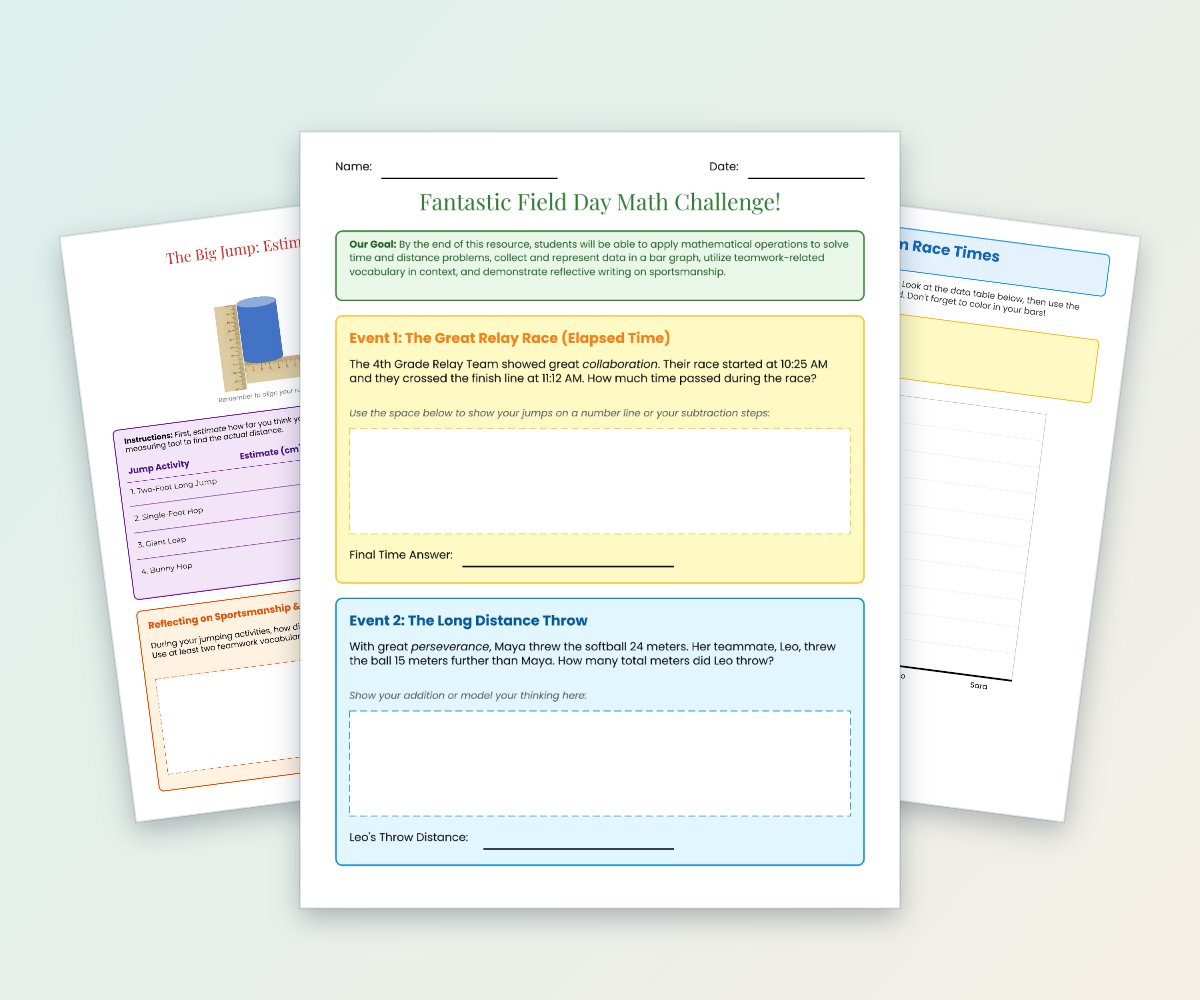
This six-page field day activity pack engages students with elapsed-time, distance, measurement, estimation, and bar-graph tasks.