
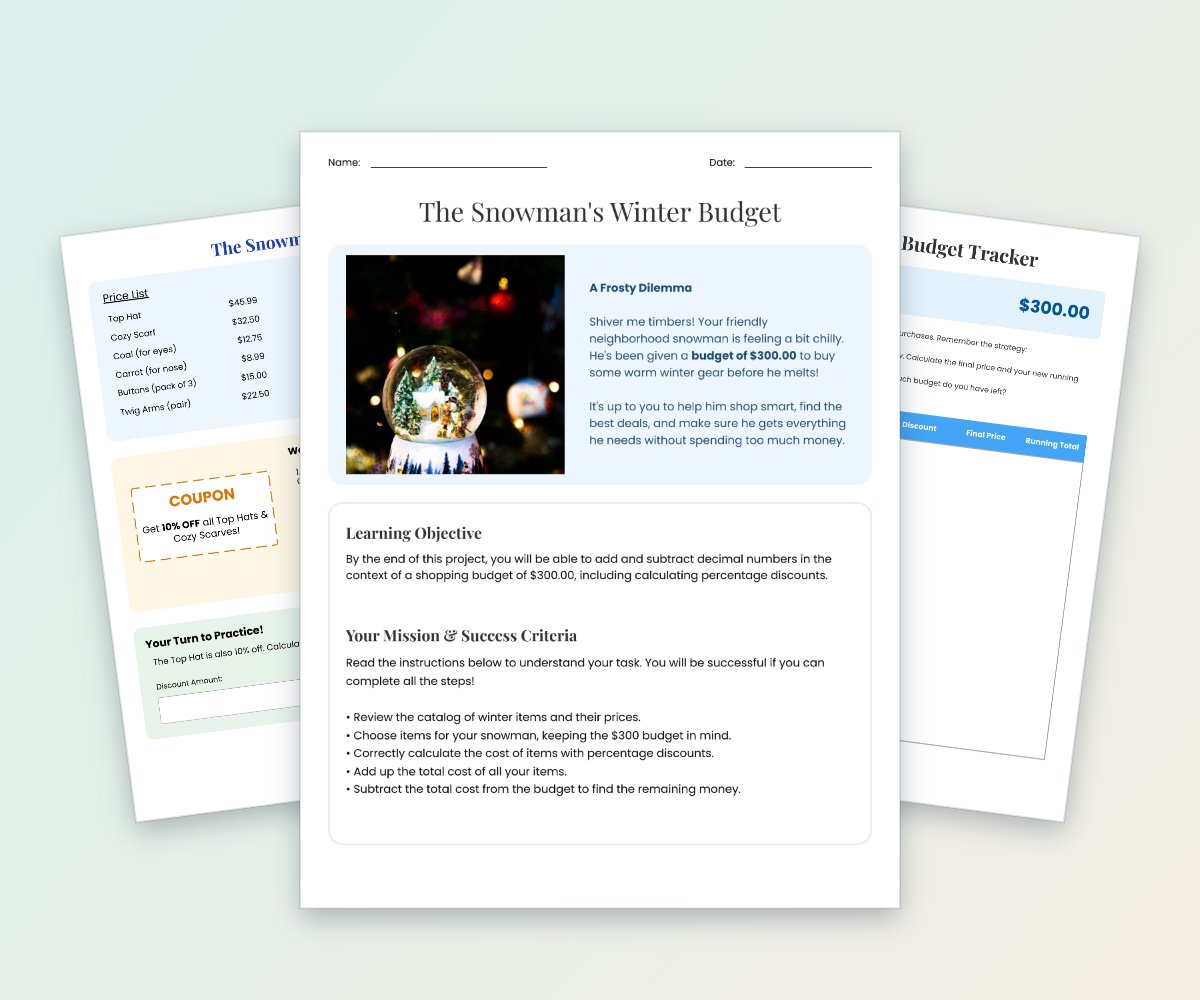
The Snowman's Winter Budget Planning Activity
Students help a snowman shop for winter items within a $300 budget while calculating percentage discounts, final prices, totals, and remaining money.
$4.50
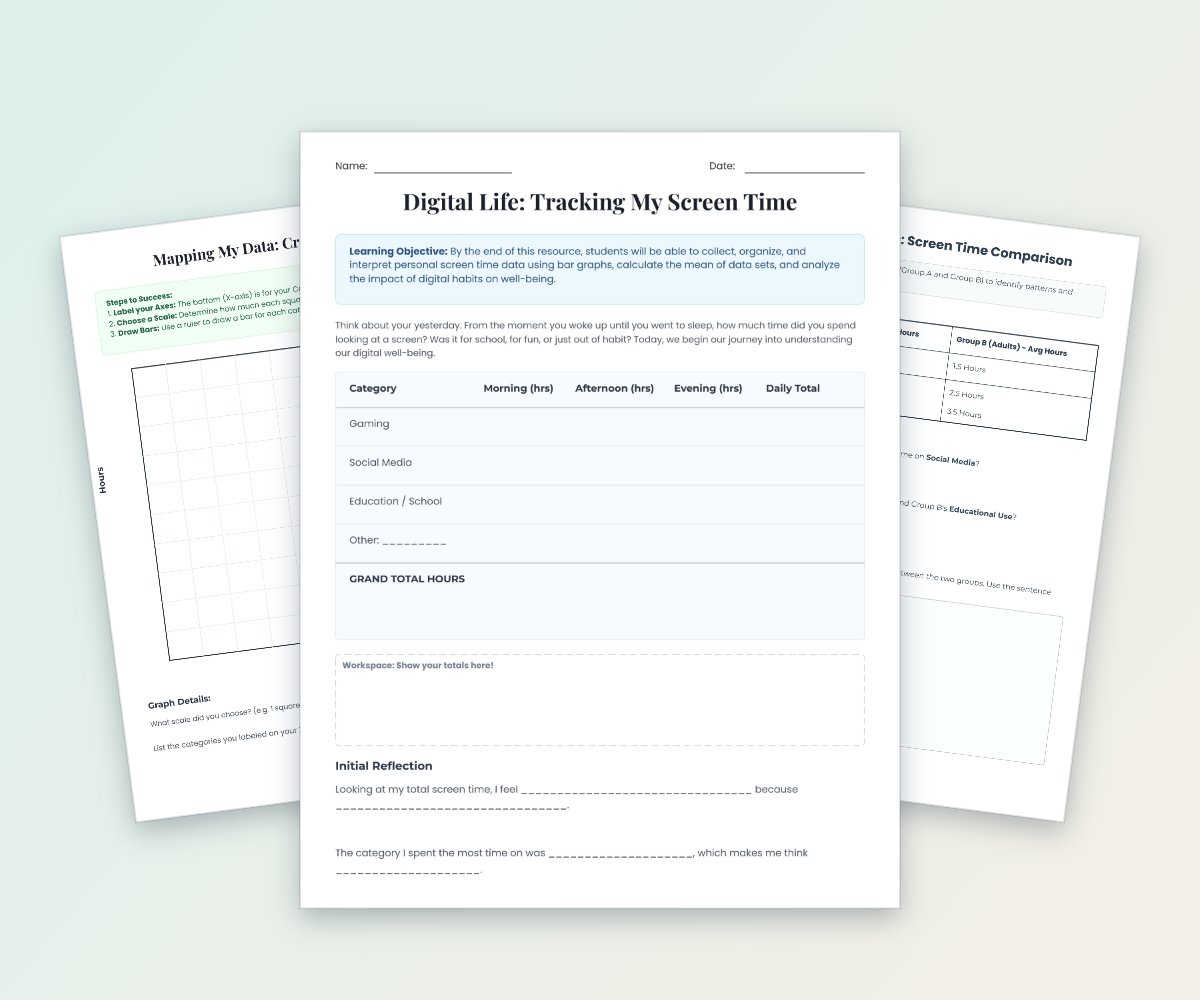
Students track their personal screen time, organize data by category and time of day, and create bar graphs.
Students track their personal screen time, organize data by category and time of day, and create bar graphs. They compare sample data sets, calculate mean averages, and reflect on how digital habits affect well-being.
For use by one educator and their students. Need a school or team licence? Contact us before sharing.
Watermarked, reduced-quality preview. The downloaded files are the full, unwatermarked pages.
Students help a snowman shop for winter items within a $300 budget while calculating percentage discounts, final prices, totals, and remaining money.
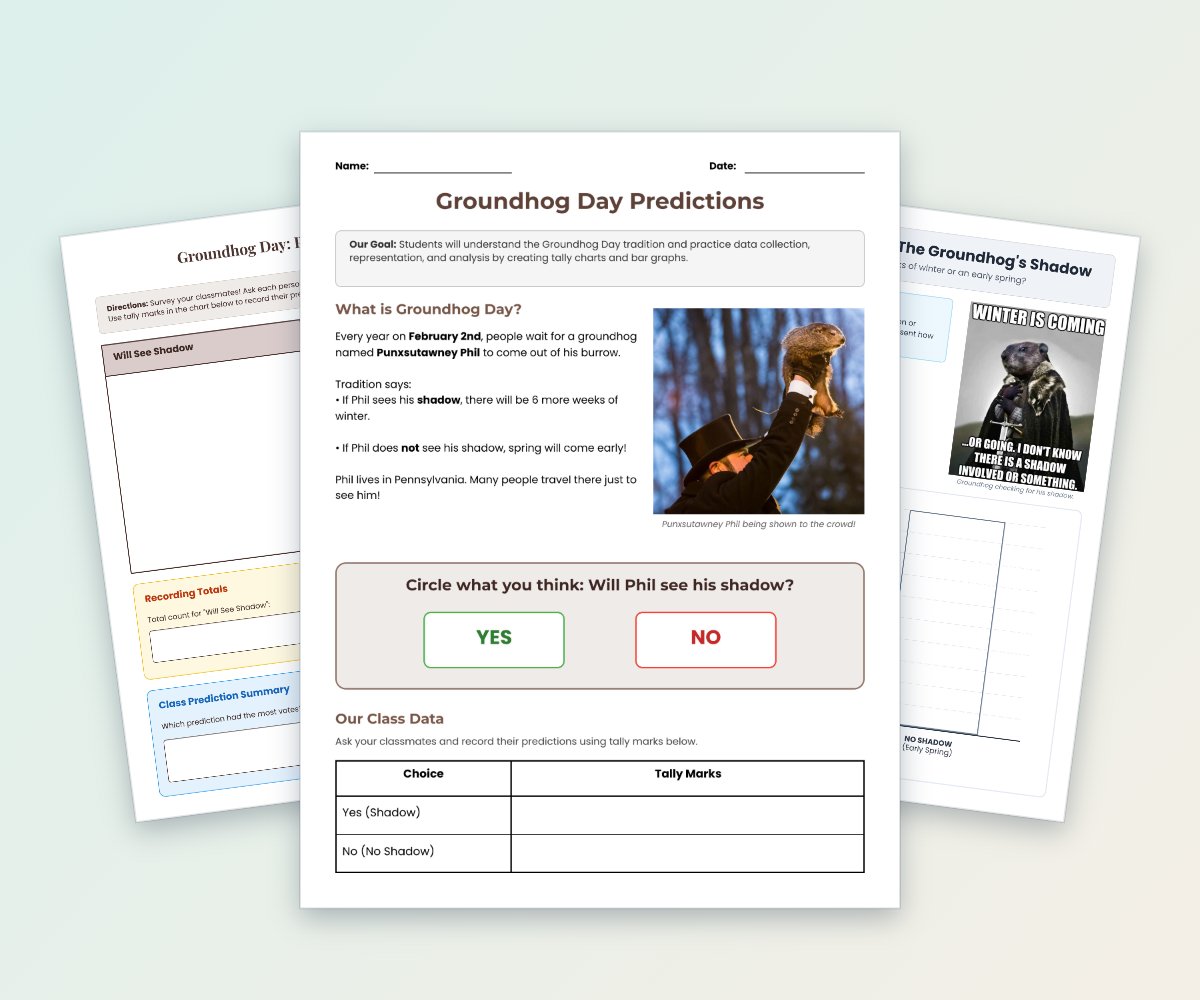
Students learn about the Groundhog Day tradition, survey classmates about their predictions, and record results with tally marks.
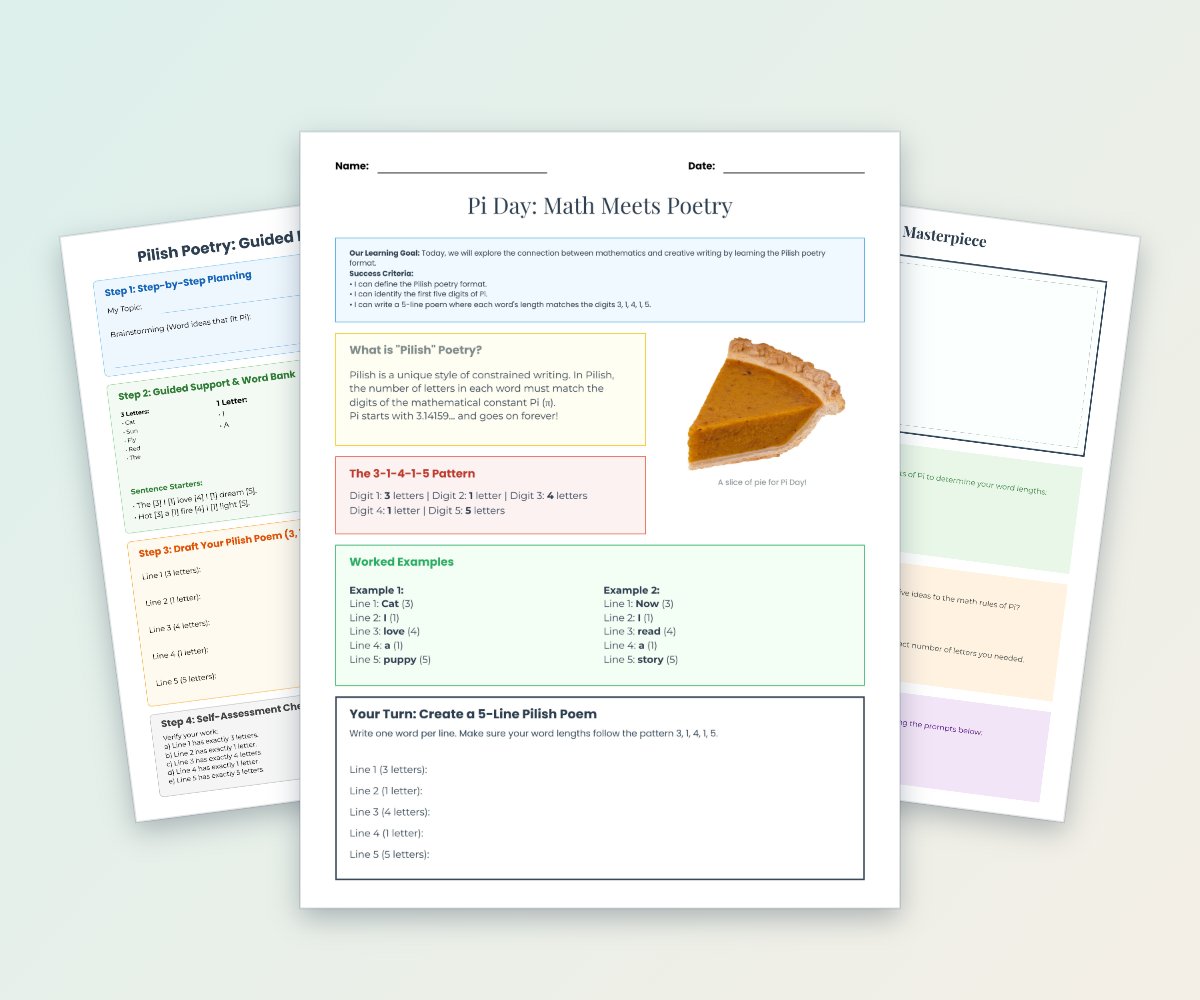
Students explore the digits of pi through Pilish, a constrained poetry format in which word lengths follow a numerical pattern.
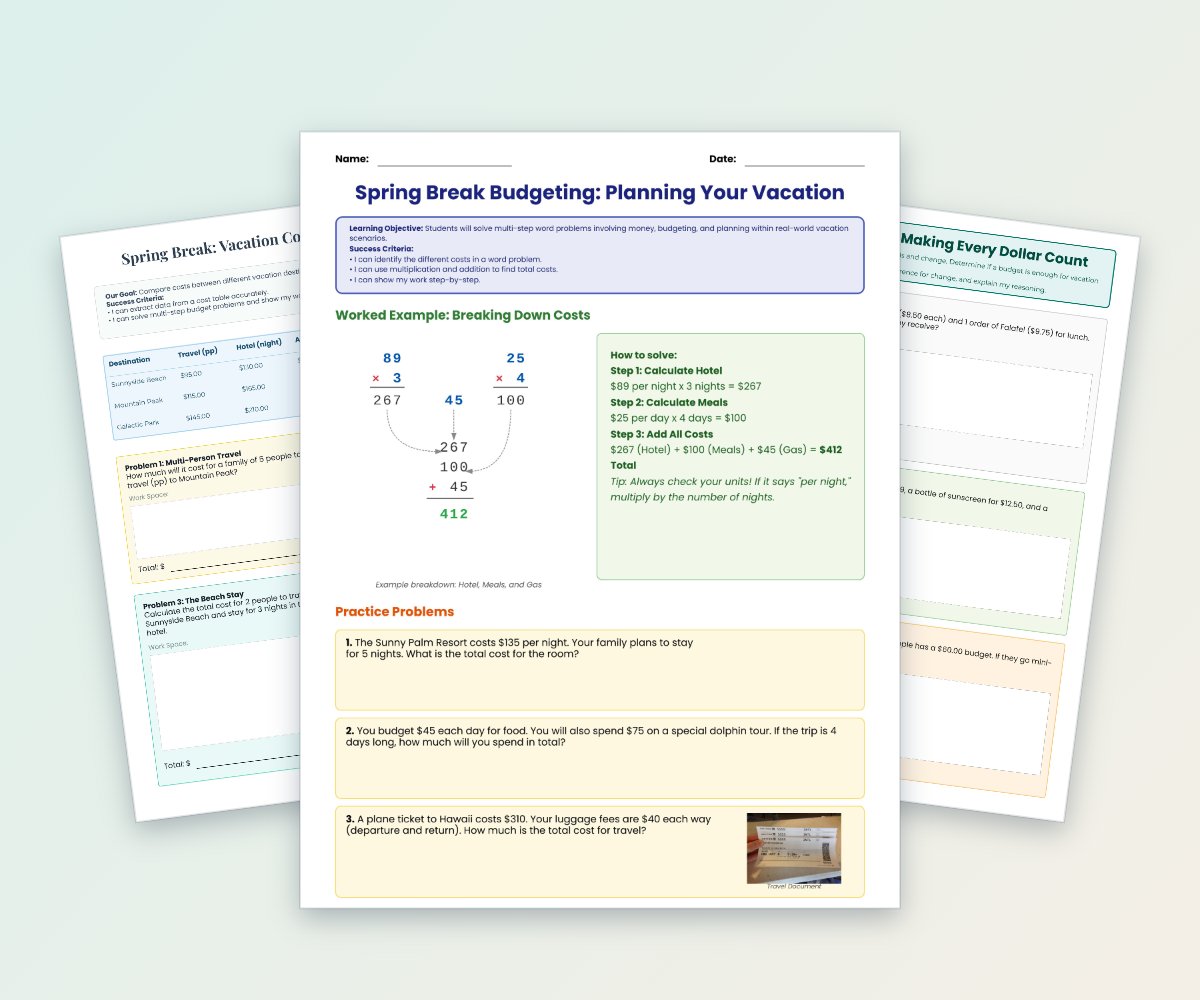
Students practice multiplication, addition, subtraction, cost comparison, and budgeting through realistic spring break vacation scenarios.
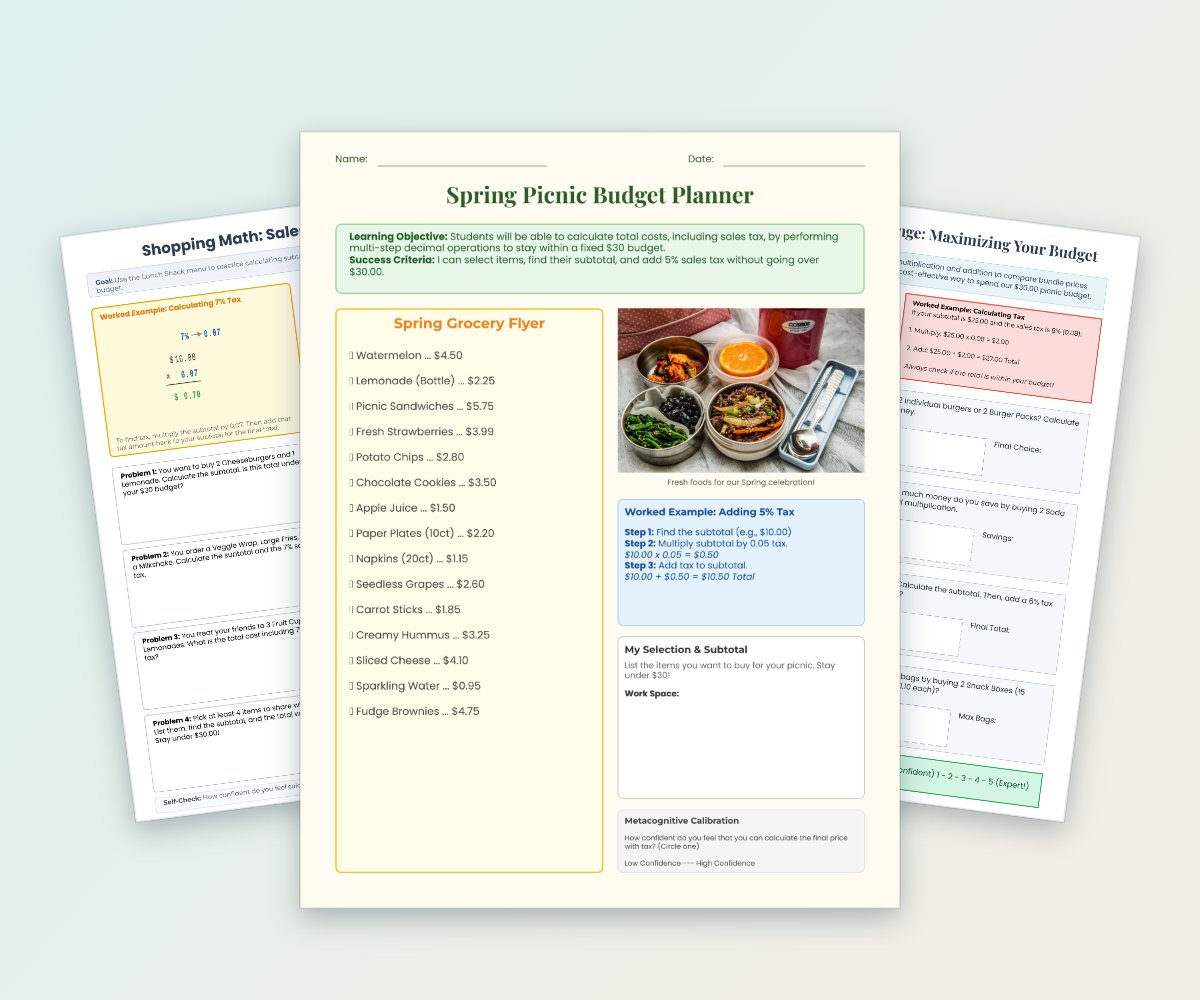
Students plan picnic purchases using grocery and restaurant flyers, calculate subtotals and sales tax, and stay within a fixed budget.
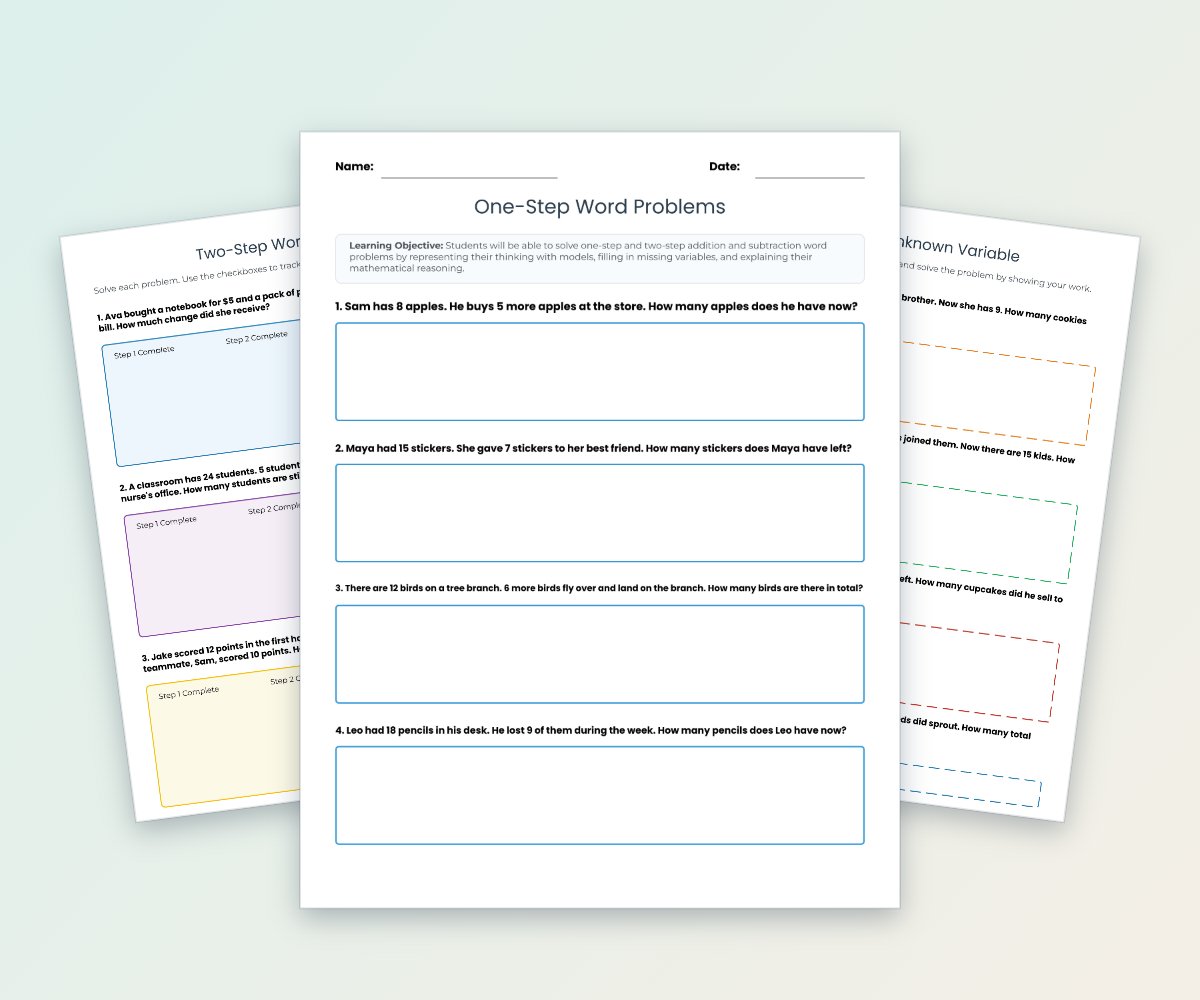
This six-page practice pack helps students solve one-step and two-step addition and subtraction word problems.