
Gingerbread House Design Challenge
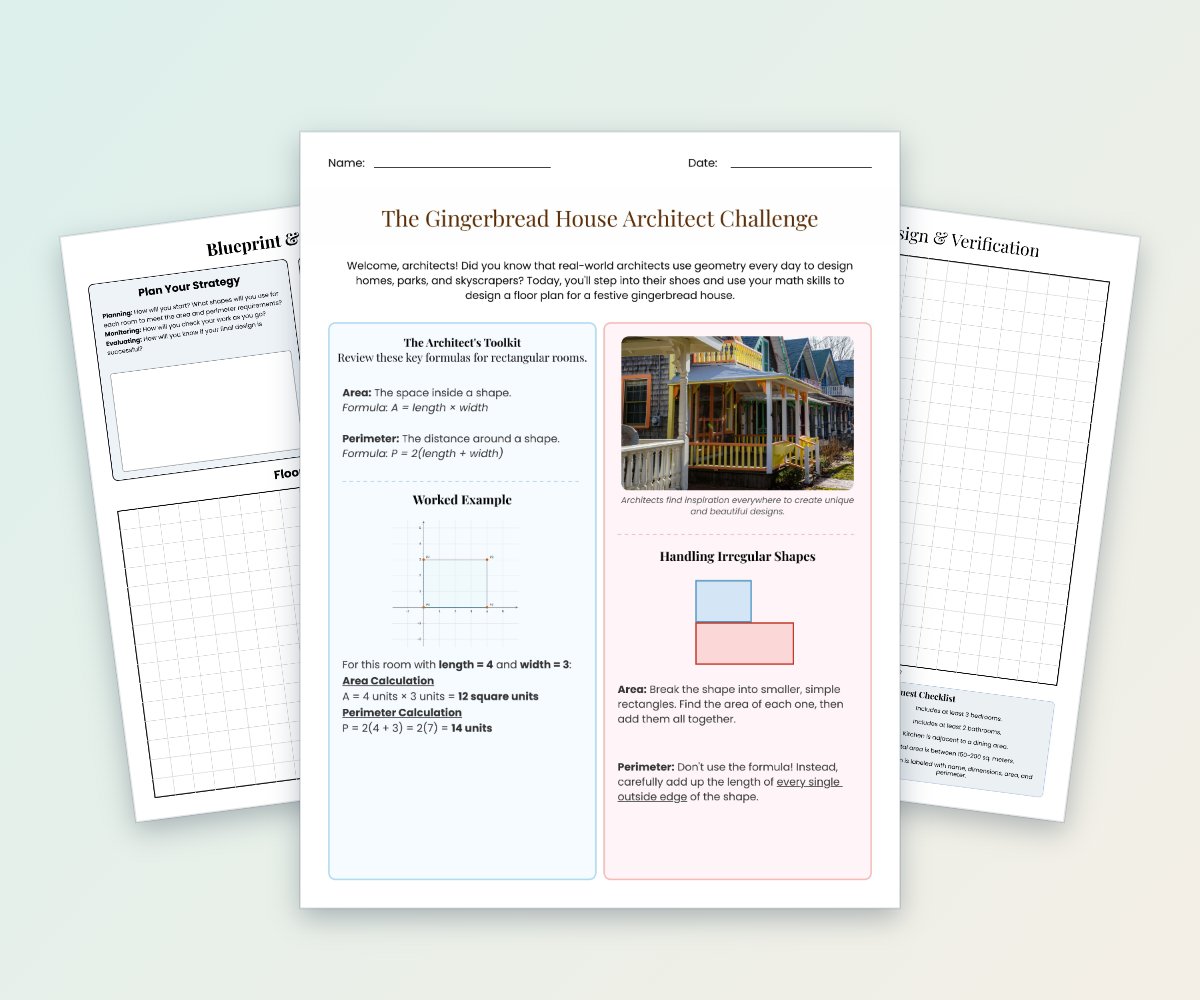
Students become architects as they design a gingerbread house floor plan using area, perimeter, irregular shapes, and scale.
$4.50
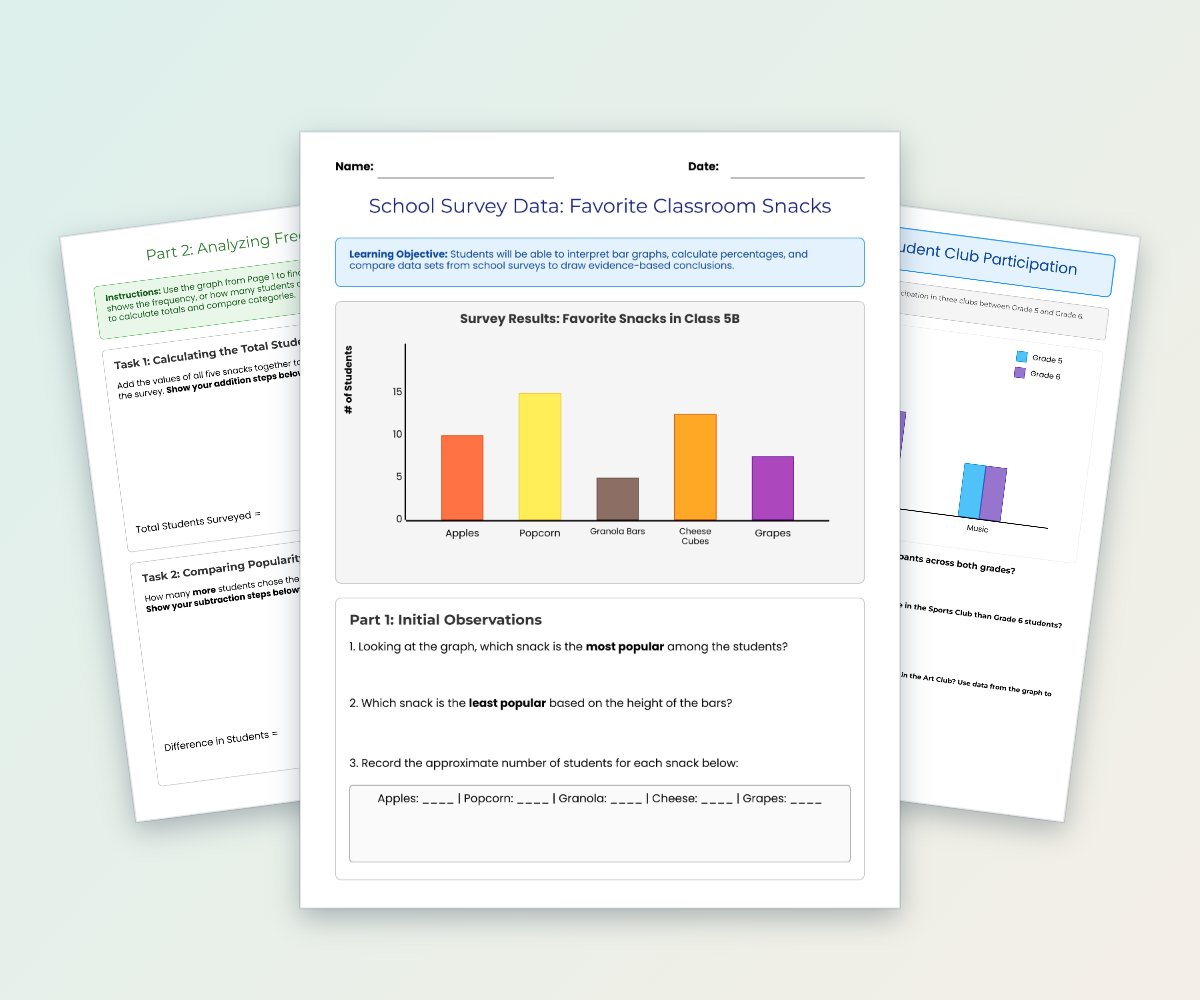
Students analyze bar graphs and grouped bar graphs using school survey and club participation data.
Students analyze bar graphs and grouped bar graphs using school survey and club participation data. The six-page activity guides learners through identifying trends, calculating totals and differences, and converting data to percentages.
For use by one educator and their students. Need a school or team licence? Contact us before sharing.
Watermarked, reduced-quality preview. The downloaded files are the full, unwatermarked pages.
Students become architects as they design a gingerbread house floor plan using area, perimeter, irregular shapes, and scale.
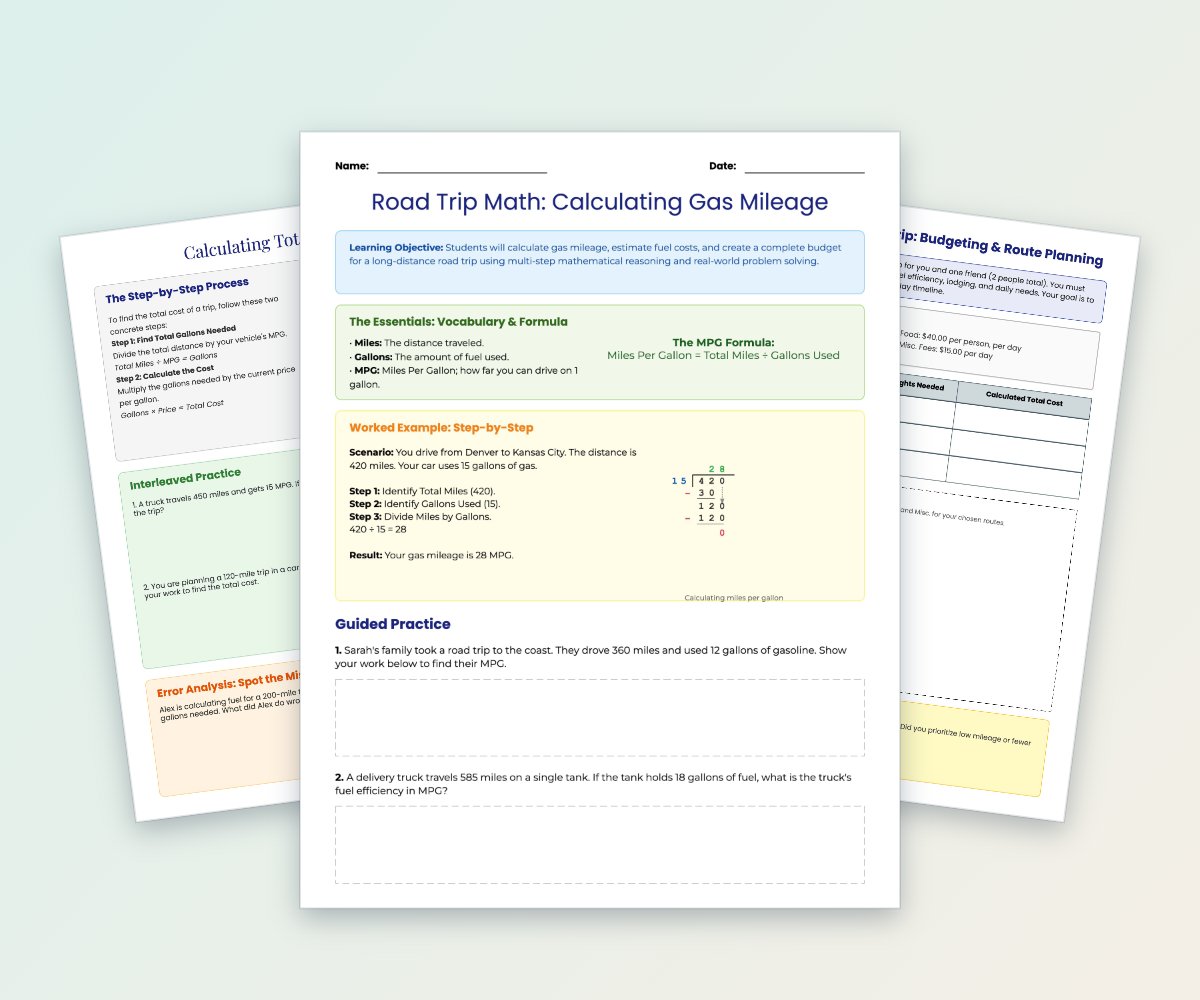
Students calculate miles per gallon, estimate fuel costs, analyze errors, and create a budget for a long-distance road trip.
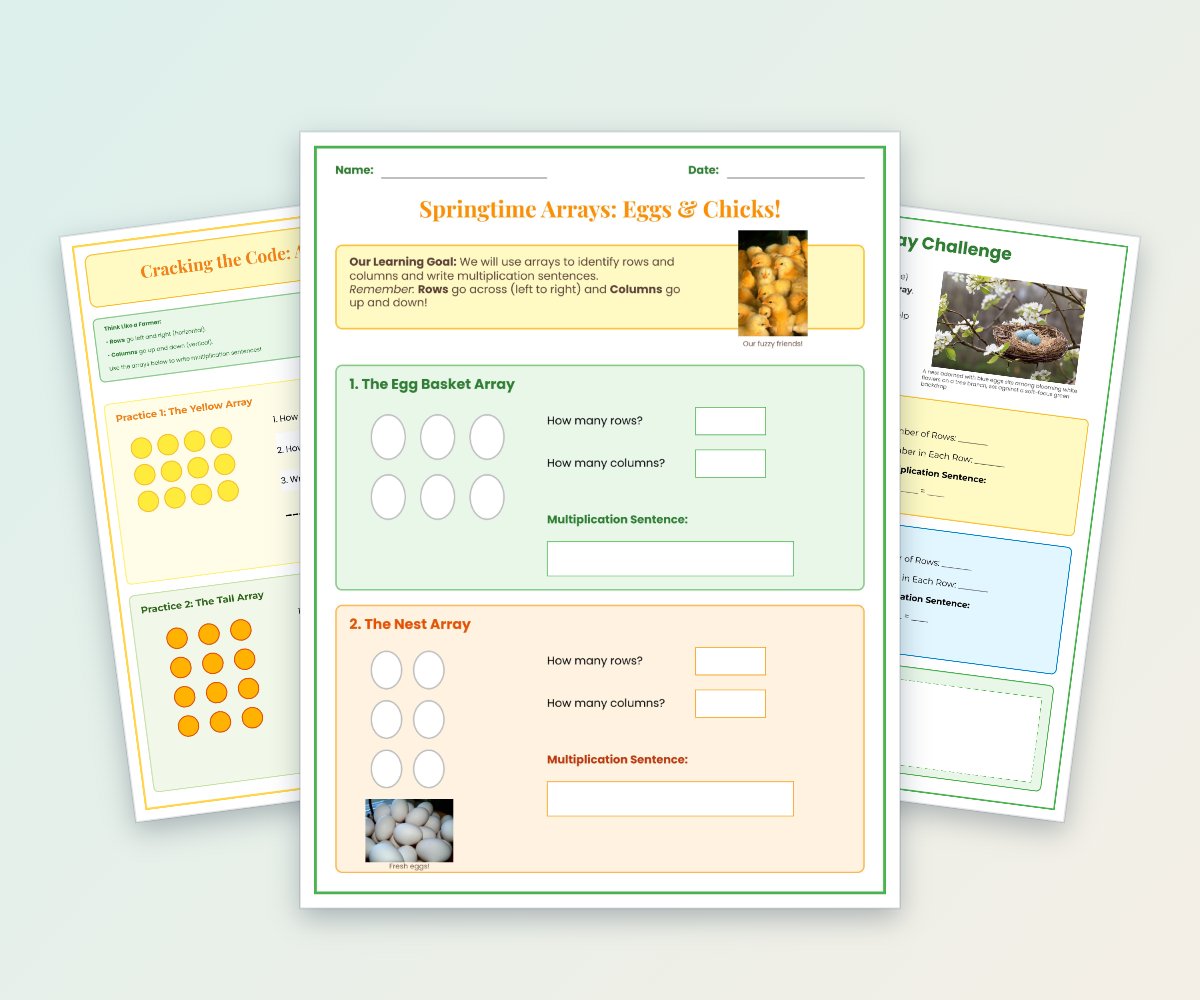
Students identify rows and columns, write multiplication sentences, and represent facts using spring-themed egg and chick arrays.
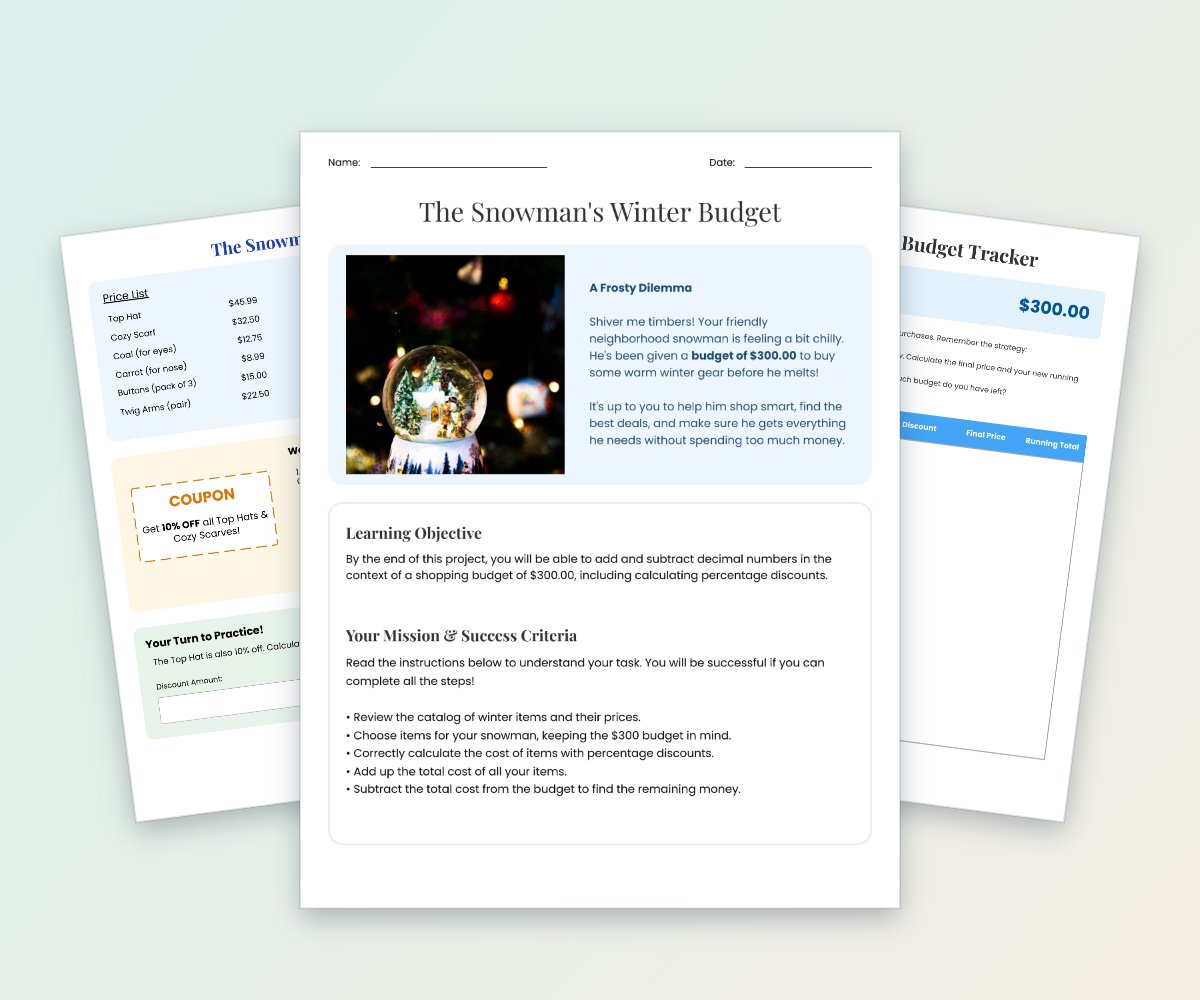
Students help a snowman shop for winter items within a $300 budget while calculating percentage discounts, final prices, totals, and remaining money.
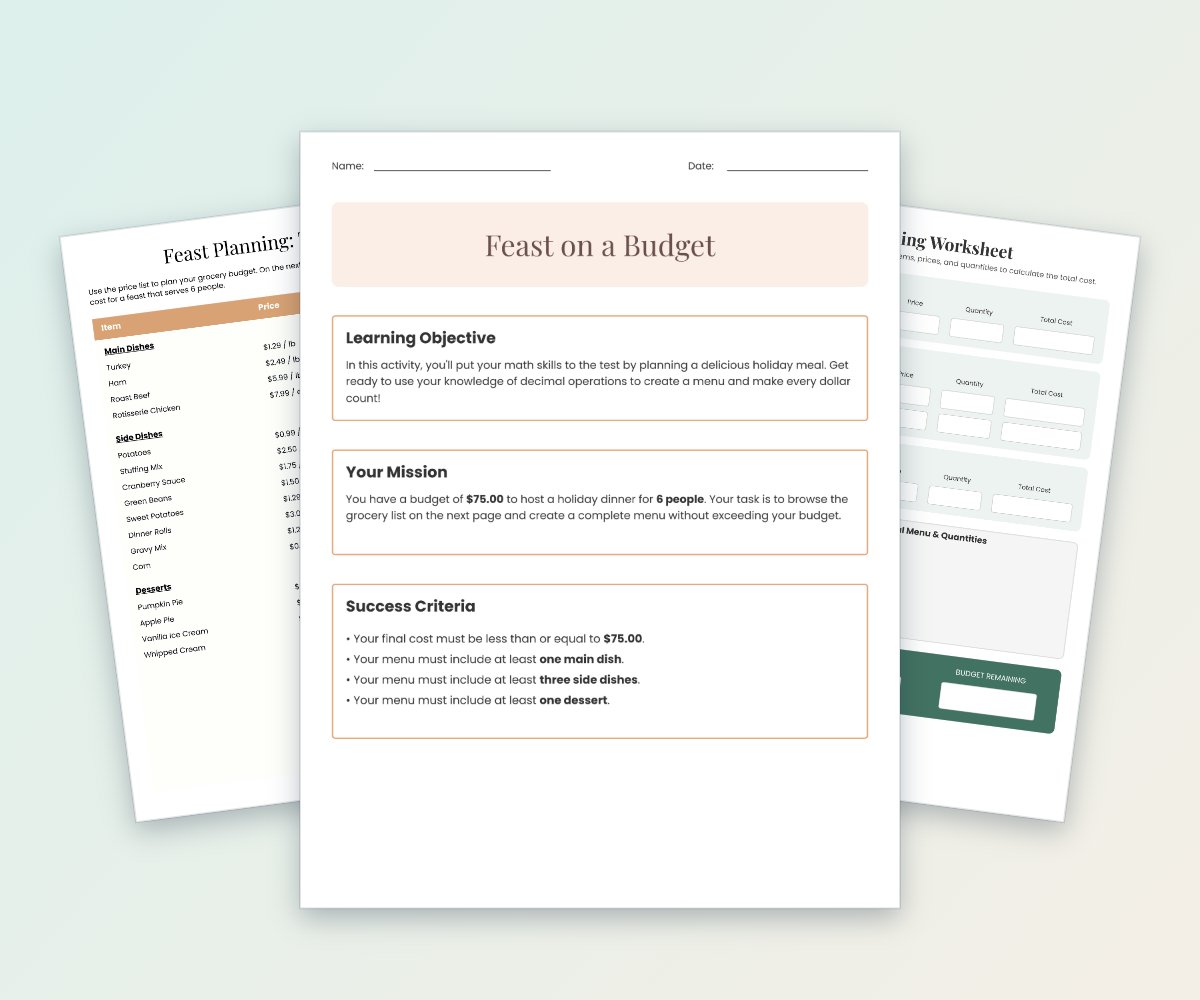
Students plan a holiday dinner for six people using a $75 budget and a grocery price list.
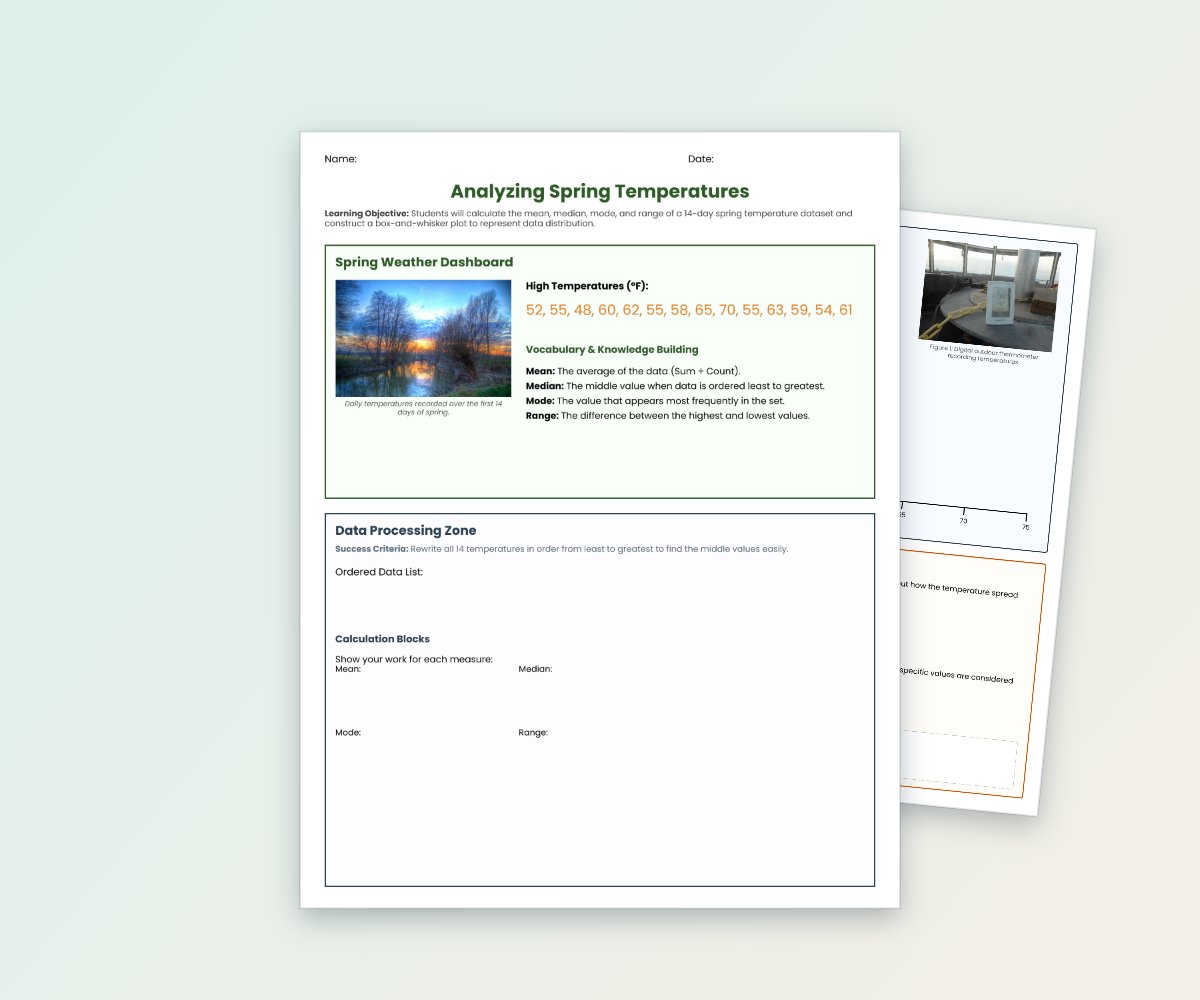
Students analyze a 14-day spring temperature dataset by calculating the mean, median, mode, and range.